
Fast search over a public dataset
- Case study 1
- 150 min
- Optional · 1 case study needed for the certificate
Case study 1 of 2 · Frontend Architecture and Performance for AI AppsFast search over a public dataset
1. Web foundations bridge
2. Components and application structure
3. Data fetching and state management
4. AI-specific interaction states
5. Performance and scalability
6. Security, accessibility and handoff
What you will be able to do
Build a search page over 9,051 real airports, served by a tiny API that you write. First measure a quick prototype. Then move the search to the server, fix the stale-response race that this brings, draw only the rows in view, and split the code. Measure each step under one measure, and decide with numbers.
The starter is a working prototype: a small API in Node.js with no packages, and a React page. The finished project is the result, for when you are stuck. The code is under the MIT licence; the data and the world map are in the public domain.
Before you startWhat to know and to have ready
What you need to know
This case study uses the whole course on a project that is not the ticket desk. It leans most on Rendering and effects (the race and the cleanup), Query lifecycle (keys and cancellation), Pagination and forms (pages with a cursor), Measure the browser and Load less work (first rows, the phone-like profile, virtual lists, code splitting).
What you need on your computer
- Node.js 24 (LTS), npm, VS Code and curl, as in Set up the ticket desk.
- An internet connection for one
npm install(about 130 MB) and for Playwright’s Chromium (about 100 MB, once). - About 2.5 hours, of which about 20 minutes are measurements that keep your computer busy.
Tested on macOS (Apple M4, 16 GB) with Node.js 24.18.0 and Chromium 156. The Windows (PowerShell) and Linux commands are the same npm and node commands; they were not run. Every time on this page is from the course team’s laptop, with other work running. Your times will differ; the differences are what matter.
The situation
Section titled “The situation”Brightway Travel is a small travel agency. Nadia leads its phone team. While a customer talks, an agent looks up an airport: “Is Orly in Paris?” “Which airport is LCY?” Leo, the agency’s only developer, built a search page in an afternoon. It works, but it feels heavy, and the same search will soon go on the agency’s website, where most visitors use a phone. The people and the agency are invented; the airports are real.
Nadia’s rule is simple: “When I type, I want the rows for what I typed. Not for something that I typed a second ago.”
The objective. A visitor opens the page and types a word. The page must show the right rows, never the rows of an older search. It must do it quickly, on an office computer and on a phone. One measure decides between the versions: the time from opening the page until the rows for the typed word are on the screen and stay there. Four more numbers explain it: the first rows, the time after the last key, the elements in the page, and the time from a click on a row to its details.
What you will build
Section titled “What you will build”
Text description of the diagram
On the left, the starter asks for all 9,051 airports, searches them in the browser and draws every match. On the right, the server searches and pages, and TanStack Query keeps each search apart. A virtual list draws only the rows in view, and the details’ code arrives after the first rows.
| Part | What changes | Measured after it |
|---|---|---|
| 1 | nothing: the measure, and the starter’s numbers | yes |
| 2 | the API searches and pages; the page asks it at every key press | yes: the race |
| 3 | TanStack Query: a key per search, old requests closed | yes |
| 4 | a virtual list that loads the next page near the end | yes |
| 5 | the details and the map in their own file | yes, twice |
| 6 | the fair comparison, with the other way done well | – |
| 7 | new input, end to end | yes |
The data
Section titled “The data”The data is OurAirports, a site where volunteers keep a list of the world’s airports. It says: “All data is released to the Public Domain, and comes with no guarantee of accuracy or fitness for use.” The full file has 86,236 airports, heliports and closed fields, and it changes every night.
So the project keeps a fixed copy, data/airports.csv: the 9,051 places that are not closed and have an IATA code, the three letters on bags and tickets. That is enough rows for “draw every row” to be slow, and few enough to download at once. DATASET.md in the project is the dataset card: the source, the exact changes, the checksum and the limits.
One row is one airport. The page uses these columns:
| Column | Meaning | Example |
|---|---|---|
iata |
the IATA code, unique in this file | ORY |
name |
the airport’s name | Paris-Orly Airport |
type |
large_airport, medium_airport, small_airport, seaplane_base or heliport |
large_airport |
municipality, country |
the city it serves, and the country | Paris, France |
latitude, longitude |
its position, for the map | 48.7233, 2.3794 |
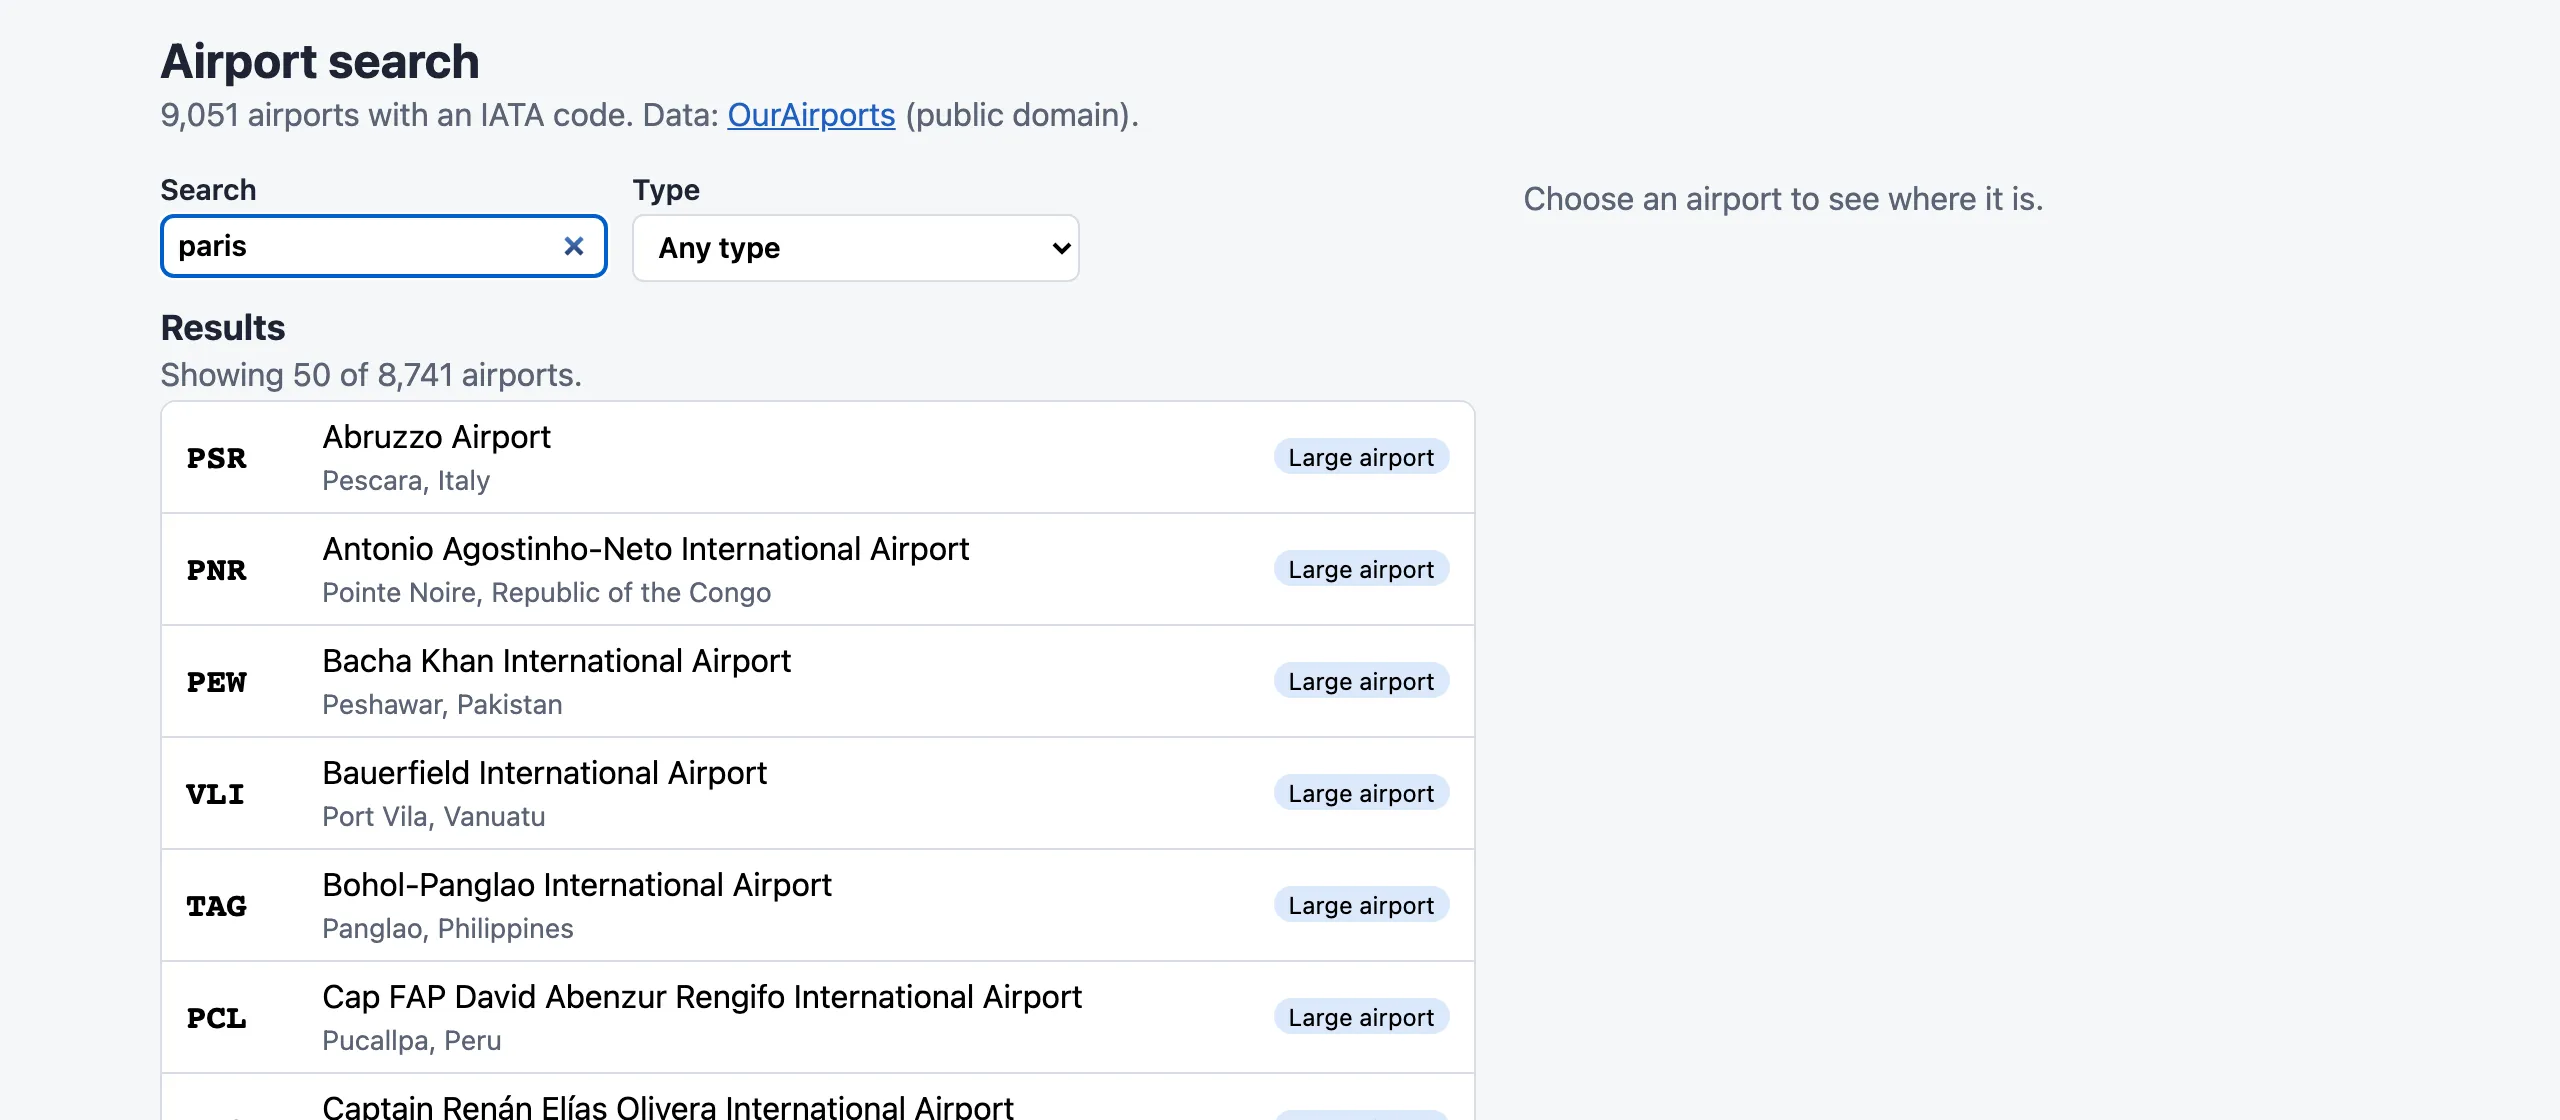
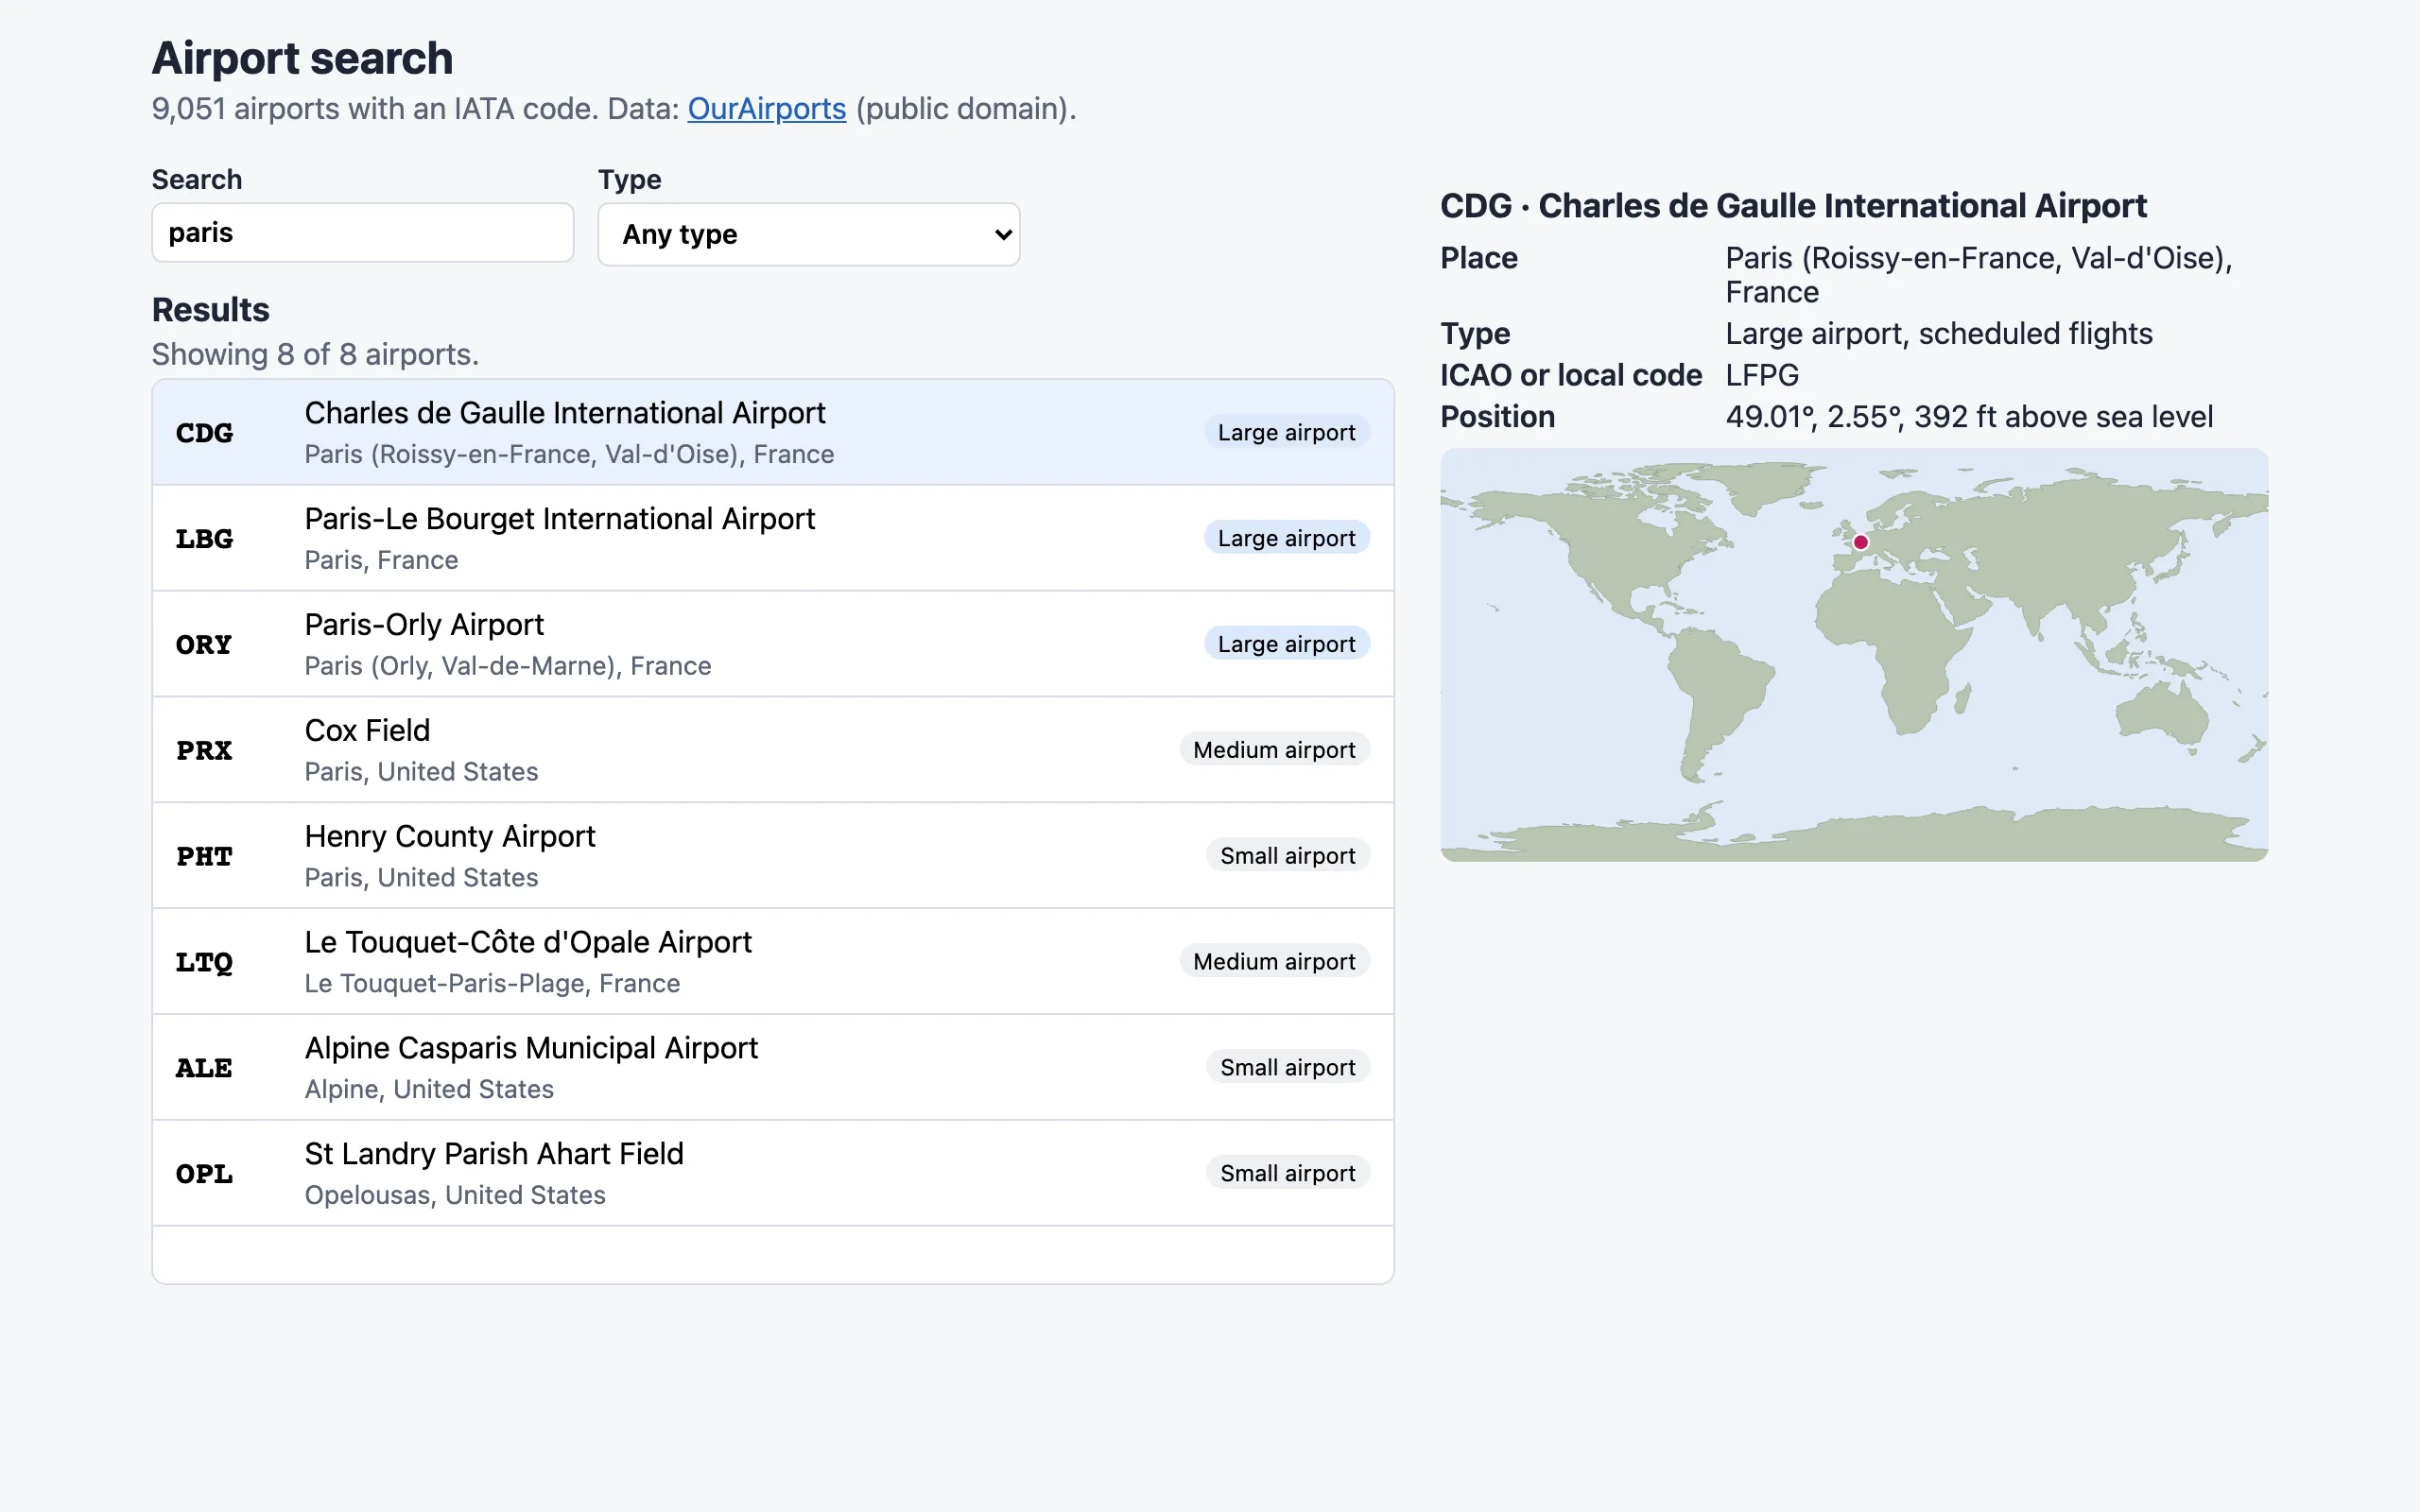
Two checks come before any code. First, the file must be the one that this page’s numbers come from, so the project checks its SHA-256. Second, look at what a short search finds. The search looks for the typed letters anywhere in the code, the name, the city and the country:
| Search | Airports that match |
|---|---|
p |
8,741 |
pa |
1,680 |
par |
160 |
pari |
12 |
paris |
8 |
What this tells us. One letter matches almost everything: almost every name contains “Airport”, and “Airport” contains a p. A real search engine has the same shape: a short search is much more work than a long one. Keep this table in mind for Part 2.
Set up the project
Section titled “Set up the project”-
Download the starter project from the box at the top of this page. Unzip it into your projects folder, for example
~/projects. You get the folderairport-search. -
In VS Code, choose File > Open Folder and open
airport-search. Open a terminal: Terminal > New Terminal. -
Install the packages, check the data and run the tests. The commands are the same on macOS, Linux and Windows (PowerShell):
Terminal window npm installnpm run check:datanpm testOutput of the last two commands (parts) data/airports.csv: 9,051 airports, 883,430 bytes, SHA-256 15c19f931828… is correct…ℹ tests 6ℹ pass 6ℹ fail 0…Test Files 1 passed (1)Tests 2 passed (2)package.jsonalready has the packages of the finished project. They are the course’s versions: React 19.3.0, TanStack Query 5.104.1, TanStack Virtual 3.14.15, Vite 8.3.4 and@playwright/test1.64.0. -
Start the API in this terminal.
--slowadds a simulated server time, explained below:Terminal window npm run api -- --slowOutput Airport search API on http://127.0.0.1:8200 (slow: 60 ms + 0.1 ms per match, simulated)Data: OurAirports (public domain), 9,051 airports with an IATA code. -
Open a second terminal and start the page with
npm run dev. Open http://localhost:5173/ and typeparis.
Why a simulated server time. On your computer, the API searches 9,051 rows in under 10 ms. A real server is slower, and its time grows with the work: more matches to sort, count and send. --slow makes every answer wait 60 ms plus 0.1 ms for each matching airport. So “p” waits 934 ms and “paris” 61 ms. This is the rule of the course’s mock ticket API. It is constructed, and every number below that depends on it says so. Everything else is real: the data, the browser, the sizes and the drawing.
Part 1: measure the prototype
Section titled “Part 1: measure the prototype”The prototype
Section titled “The prototype”Leo’s page is short. When it opens, it asks for every airport at once. Then it searches them in the browser at every key press, and draws every match:
useEffect(() => { const controller = new AbortController(); allAirports(controller.signal).then( (all) => setState({ status: 'success', airports: all.items, error: null }), (error: Error) => { if (!controller.signal.aborted) setState({ status: 'error', airports: null, error }); }, ); return () => controller.abort();}, []);const all = useAllAirports();const airports = useMemo(() => (all.airports ? matchAirports(all.airports, filter) : []), [all.airports, filter]);// … then every match is drawn: {airports.map((a) => <li key={a.iata}>…</li>)}This design has a real strength: after the download, a search needs no network. It also has costs that nobody has measured yet.
The measure
Section titled “The measure”measure/measure.mjs is built like the course’s own measurement scripts. It opens the page in Playwright’s Chromium, as a new visitor with an empty cache, and reads two marks that the page leaves:
performance.mark('search:first-rows')when the first rows are drawn, as in Measure the browser;data-results-for="paris"on the results line: the search that the rows on the screen answer. A small watcher in the page writes down each change of it, with its time.
It has four groups. Each one runs on a fast connection and on the course’s phone-like profile: 150 ms round trip, 1.6 Mbit/s down, and a CPU four times slower.
| Group | What it does | What it reports |
|---|---|---|
open |
opens the page, 5 times | first rows, JavaScript and data downloaded, elements in the page |
type |
opens the page, waits, types paris with 120 ms between keys, 10 times |
which search the rows answer 3 s later, the time after the last key, long tasks, requests sent and closed early |
session |
the one measure: opens the page and types paris at once, 5 times |
the time from opening the page until the rows for paris are on the screen and stay |
click |
loads 2,000 rows, then clicks two rows, 3 times | the elements in the page, and the time from each click to its details on the screen |
Measure a production build, never npm run dev: development mode adds checks that make React much slower. Install Chromium once, then build and serve the page:
npx playwright install chromiumnpm run buildnpm run previewIn a third terminal, run the four groups. The API keeps running with --slow:
npm run measure -- open --label starternpm run measure -- type --label starternpm run measure -- session --label starternpm run measure -- click --label starterEach run prints its medians and writes results/starter-<group>.json with every pass, the machine and the load. The course team’s runs (medians; server time simulated):
| Measure | Fast | Phone-like |
|---|---|---|
| First rows | 1,348 ms | 5,224 ms |
| Data downloaded | 381 kB | the same |
| JavaScript (one file) | 101.4 kB gzip | the same |
| Elements in the page | 54,338 | the same |
Type paris: last key to the right rows |
3.3 ms | 8.7 ms |
Type paris: long tasks while typing |
263 ms | 1,245 ms |
Open and type paris: the right rows |
1,041 ms | 3,758 ms |
What this tells us. The prototype is good at one thing and poor at three.
- Good: after the download, a search is instant. The rows for
pariswere on the screen 3.3 ms after the last key. No network can beat that. - Poor: the first rows. Nothing appears until all 381 kB of airports have arrived and all 9,051 rows are drawn. On the phone-like profile, that took 5.2 seconds.
- Poor: the page freezes while you type. The first key,
p, matches 8,741 airports, and React draws a row for each. A long task is work that keeps the browser busy for more than 50 ms, so that it cannot answer a key or a click. Whilepariswas typed, long tasks added up to 263 ms, and to 1,245 ms on the phone-like CPU. - Poor: the page is huge. It holds 54,338 elements for a screen that shows about ten rows.
Part 2: search on the server
Section titled “Part 2: search on the server”The idea: ask for what the screen shows
Section titled “The idea: ask for what the screen shows”A library does not hand you every card in the catalogue drawer. You ask for “Paris”, and the librarian gives you the first few cards, with a bookmark for the next ones. Pagination and forms built this for the ticket list: the server filters and pages, and the page asks for one page of 50, with a cursor for the next.
Build it: the API
Section titled “Build it: the API”-
Add
search()andpage()toapi/airports.mjs.search()keeps the airports whose code, name, city or country contains the words, and sorts the best first. The code itself comes first, then names and cities that start with the words. The starter’ssrc/search/match.tsalready has the same rules.page()cuts one page and makes the cursor:api/airports.mjs (part) export function page(matches, limit, after = '') {const start = after ? Number.parseInt(Buffer.from(after, 'base64url').toString(), 10) : 0;if (!Number.isInteger(start) || start < 0) return null;const items = matches.slice(start, start + limit);const end = start + items.length;return { items, next: end < matches.length ? Buffer.from(String(end)).toString('base64url') : null, total: matches.length };}Here the cursor holds a position. That is safe only because this data never changes while the API runs. With data that changes, use the key of the last row, as the ticket API does.
-
Add the route
GET /v1/airportstoapi/server.mjs. It checkslimit(1 to 100),type,countryandafter, and answers400with the error shape when one is wrong. Copy the route andapi/server.test.mjs(five more checks) from the finished project. -
Restart the API (
Ctrl+C, thennpm run api -- --slow) and try it:Terminal window curl -s "http://127.0.0.1:8200/v1/airports?q=paris&limit=2"curl -s "http://127.0.0.1:8200/v1/airports?limit=500"Output (the first answer shortened) {"items":[{"iata":"CDG","ident":"LFPG","name":"Charles de Gaulle International Airport","type":"large_airport","municipality":"Paris (Roissy-en-France, Val-d'Oise)","country_code":"FR","country":"France",…},{"iata":"LBG",…}],"next":"Mg","total":8}{"error":{"code":"invalid_parameter","message":"limit must be a whole number from 1 to 100."}}One page of 2 is a few hundred bytes. For comparison,
/v1/airports/allis 2,323,446 bytes of JSON, or 380,168 bytes with gzip.
Build it: the page, a first try
Section titled “Build it: the page, a first try”Now the list asks the server at every change of the search, in an effect. A Load 50 more button asks for the next page. This is the obvious first try, and the one that Rendering and effects warned about:
useEffect(() => { searchAirports({ q, type: filter.type }).then( (page: AirportPage) => setShown({ q, airports: page.items, next: page.next, total: page.total }), setError, );}, [q, filter.type]);Copy src/api/airports.test.ts and src/search/ResultList.test.tsx from the finished project, and run npm test. Two of the six page tests fail, as they should at this step:
FAIL src/search/ResultList.test.tsx > draws only the rows in view, not every loaded airport FAIL src/search/ResultList.test.tsx > an old answer that arrives late does not replace the new one, and its request is closed… Tests 2 failed | 4 passed (6)Build, serve and measure this version with the label paged-naive. Then type paris yourself, quickly:
- answered
- “p”, answered
- closed early
Text description of the chart
Each bar runs from when a request was sent to when its answer arrived: "p" from 6 to 949 ms; "pa" from 129 to 362 ms; "par" from 252 to 334 ms; "pari" from 375 to 440 ms; "paris" from 497 to 562 ms. The answer for “p” arrives after the answer for “paris”, so its rows replace them.
What this tells us. This is the stale-response race of Rendering and effects, on real data. The answer for p needs about 934 ms of server time; paris, sent last, needs 61 ms. So p arrives last, and its rows stay. In the course team’s runs, the rows were wrong 10 times out of 10, on both profiles, and always for p. In the session measure, it was wrong in all 5 passes on both profiles; sometimes the first answer, for the empty search with all 9,051 matches, came last of all. No error appears anywhere.
The first rows came sooner, though: 1,010 ms on the fast profile and 1,929 ms on the phone-like one, against 1,348 and 5,224 ms. The page downloaded 3.1 kB of data instead of 381 kB, and held 333 elements instead of 54,338.
Part 3: fix the race
Section titled “Part 3: fix the race”The ticket desk fixed this race twice: with a cleanup in an effect, then with TanStack Query, in Query lifecycle. Use the library here, because it also keeps the pages and closes old requests. Wrap the app in a QueryClientProvider in src/main.tsx (staleTime 30 s, one retry), and add a hook:
export function useAirportSearch(filter: SearchFilter) { const q = filter.q.trim(); return useInfiniteQuery({ queryKey: ['airports', { q, type: filter.type }], queryFn: ({ pageParam, signal }) => searchAirports({ q, type: filter.type }, pageParam, signal), initialPageParam: '', getNextPageParam: (last) => last.next ?? undefined, });}Three details carry the fix:
- The key holds the whole search. Each search has its own entry in the cache, and the list shows only the data of the current key. So the rows of
pcan never appear forparis. - The
signal. TanStack Query gives each request a signal, andapiGetpasses it tofetch. When the search changes, nobody reads the old request any more, so the library closes it. useInfiniteQuerykeeps the pages of one search together, and asks for the next one withlast.next.
In ResultList.tsx, read the rows from search.data.pages, and let Load 50 more call fetchNextPage(). Run npm test: only the virtual-list test fails now. Then measure with the label paged-query:
| Measure (server time simulated) | Effect without cleanup | TanStack Query |
|---|---|---|
Wrong rows after typing paris (fast / phone-like) |
10 of 10 / 10 of 10 | 0 of 10 / 0 of 10 |
| Requests sent, closed early (fast) | 5, 0 | 5, 2 |
| Requests sent, closed early (phone-like) | 5, 0 | 5, 4 |
| Last key to the right rows (fast / phone-like) | never right | 65 ms / 164 ms |
Open and type paris (fast / phone-like) |
never right | 614 ms / 1,661 ms |
- answered
- “p”, answered
- closed early
Text description of the chart
"p": sent at 5 ms, closed early at 128 ms; "pa": sent at 127 ms, closed early at 250 ms; "par": sent at 250 ms, answered at 330 ms; "pari": sent at 372 ms, answered at 436 ms; "paris": sent at 495 ms, answered at 558 ms.
What this tells us. The race is gone: 0 wrong in every run. The slow request for p is closed by the browser soon after pa is typed, so its answer never comes. On the phone-like profile, more requests were closed, because each one stayed open longer. The right rows came 65 ms after the last key: the server time for paris (61 ms, simulated) plus the trip. The starter needed 3.3 ms, after its long first wait. Every key press now costs a request: that is the trade.
Part 4: draw only the rows in view
Section titled “Part 4: draw only the rows in view”The server sends 50 rows at a time, so the page starts small: 333 elements. But Nadia’s agents scroll, and each Load 50 more adds 50 rows that stay in the page. After 39 clicks, 2,000 rows are there. Load less work taught the fix: a virtual list keeps all the loaded rows as data, and puts in the page only the rows that fit in the scroll box, plus a few above and below.
Replace the list in ResultList.tsx with the finished version. It uses useVirtualizer with rows of 56 px and an overscan of 8, as the ticket desk does. It also asks for the next page by itself when the last drawn row is within 10 rows of the end. So the list scrolls on without a click. The button stays for keyboard users. Run npm test: all 17 checks pass, 11 of the API and 6 of the page. Measure with the label virtual. The click group loads 2,000 rows first; the starter always holds all 9,051:
| Measure | Starter (9,051 rows) | Every loaded row (2,000) | Virtual list (2,000) |
|---|---|---|---|
| Elements in the page | 54,338 | 12,033 | 141 |
| Click a row to its details, fast | 30 ms | 16 ms | 15 ms |
| The same on the phone-like CPU | 119 ms | 45 ms | 14 ms |
(The second click of each pass; the first click was a little slower in every version.)
What this tells us. The virtual list kept the page at 141 elements, however far the agent scrolled. On a fast computer, 2,000 drawn rows were not yet a problem: a click took about the same time either way. On the phone-like CPU, the difference showed: 45 ms against 14 ms, because a click redraws the list to mark the chosen row. And the starter’s 9,051 rows needed 119 ms, past the 100 ms under which a click feels instant. This is the course’s rule again: virtualize because of thousands of rows, not hundreds.
Part 5: send the map later
Section titled “Part 5: send the map later”The problem: a map that nobody has asked for yet
Section titled “The problem: a map that nobody has asked for yet”The details panel draws a small world map with a dot on the airport. The map’s outline is one long SVG path from Natural Earth’s public-domain map: 72,485 characters, 31.4 kB with gzip. It is in the one JavaScript file, so every visitor downloads it before the first rows, even a visitor who never opens an airport.
First try: load it on the first click
Section titled “First try: load it on the first click”Load less work taught lazy() and <Suspense>. Load the panel when the visitor opens an airport:
const DetailPanel = lazy(() => import('./details/DetailPanel').then((m) => ({ default: m.DetailPanel })));// …{selected === null ? ( <p className="muted">Choose an airport to see where it is.</p>) : ( <Suspense fallback={<p className="muted">Loading the map…</p>}> <DetailPanel airport={selected} /> </Suspense>)}npm run build && npm run size now lists two JavaScript files:
File Size Gzipassets/index-CSERPEPP.js 286.9 kB 87.6 kBassets/DetailPanel-Lq4YUBTY.js 73.7 kB 31.4 kBassets/index-D-9IoiRQ.css 2.3 kB 1.0 kBindex.html 0.4 kB 0.3 kBJavaScript: 2 files, 118.9 kB gzip in allThe hashes in the file names (CSERPEPP) change with every change of the code.
Measure it with the label split-naive:
| Measure | One file (virtual) |
Split, first try |
|---|---|---|
| JavaScript before the first rows | 120 kB | 87.6 kB |
| First rows, fast | 1,015 ms | 1,012 ms |
| First rows, phone-like | 2,008 ms | 1,851 ms |
| First click on a row (fast / phone-like) | 15 / 29 ms | 331 / 347 ms |
| Second click (fast / phone-like) | 15 / 14 ms | 13 / 14 ms |
What this tells us. The first file is 32.4 kB smaller. On the fast profile, the first rows did not change; on the phone-like one, they came 157 ms sooner. That is the course’s finding again: splitting pays on slow networks. But the first click now took over 300 ms, even on the fast profile, where the 31 kB file arrives in a few milliseconds. Why?
Why the first click waited: React’s pause after a fallback
Section titled “Why the first click waited: React’s pause after a fallback”When the panel’s code is not there yet, <Suspense> shows its fallback, “Loading the map…”. When the code arrives, React does not replace the fallback at once. It waits until at least 300 ms have passed since it showed the fallback. This stops a page from flashing when several parts load one after the other. (The constant is FALLBACK_THROTTLE_MS = 300 in React 19’s source.) So the first click costs about 300 ms, whatever the network. The course team checked that the download was not the cause: a version that loads the file after the first rows, without the next fix, still took 332 ms.
The fix: load early, and keep the old panel while you wait
Section titled “The fix: load early, and keep the old panel while you wait”Two changes, in src/App.tsx of the finished project:
const loadDetails = () => import('./details/DetailPanel');const DetailPanel = lazy(() => loadDetails().then((m) => ({ default: m.DetailPanel })));// …// Load the details' file while the visitor reads the first rows, not when they click.useEffect(() => afterFirstRows(() => void loadDetails()), []);
// A transition: if the file is not there yet, React keeps the old panel until it is.const select = (airport: Airport) => startTransition(() => setSelected(airport));// …<Suspense fallback={<p className="muted">Loading the map…</p>}> {selected === null ? <p className="muted">Choose an airport to see where it is.</p> : <DetailPanel airport={selected} />}</Suspense>- Load after the first rows.
afterFirstRows()(insrc/search/marks.ts) runs the function once the list has drawn its first rows. So the file never competes with the first rows, and it is usually there before the first click. - A transition.
startTransition()marks the change of the chosen airport as not urgent. If the code is still missing, React keeps the panel that is already on the screen until the new one is ready. So it never shows the fallback, and never waits its 300 ms. For this to work, the<Suspense>boundary must already be on the screen, so it now wraps the “Choose an airport” text too.
Measure again with the label finished:
| Measure | One file | Split, first try | Split, finished |
|---|---|---|---|
| First rows, phone-like | 2,008 ms | 1,851 ms | 1,853 ms |
| First click (fast / phone-like) | 15 / 29 ms | 331 / 347 ms | 48 / 46 ms |
| Second click (fast / phone-like) | 15 / 14 ms | 13 / 14 ms | 48 / 47 ms |
What this tells us. The first rows kept the saving, and the first click fell from over 300 ms to about 48 ms. But read the last row too: every click now takes about 48 ms, against about 15 ms with one file. A transition is less urgent work, and React gives it a lower priority. Both are under 100 ms, so a person does not feel the difference. Still, the code split cost something on every click, and it bought 156 ms on a phone’s first load. For a site whose visitors are mostly on phones, that trade is worth it. For an office tool only, one file would be as good.
Common mistake
A split that made the page slower
Symptom: after code splitting, the first click on an airport shows “Loading the map…” for about a third of a second, on any network. The tests pass.
Cause: a new <Suspense> fallback, then React’s pause of up to 300 ms before it shows the content that replaced a fallback.
Fix: load the file before it is needed, after the first rows. Change the state in startTransition(), inside a boundary that is already on the screen. Then measure the click again: a split is a change like any other, and it can make one thing worse.
Part 6: the fair comparison
Section titled “Part 6: the fair comparison”The other way, done well
Section titled “The other way, done well”Is the server really better, or was the starter just badly built? The fair question compares the server with the best version of “download everything”. That version is in the project as the stage client-virtual. It has the starter’s download and search in the browser, plus the virtual list and the late map file. Only the data strategy differs from the finished page. The course team built and measured it like the others; the chart calls it “All”.
One measure, the same conditions
Section titled “One measure, the same conditions”Every version ran the same groups on the same laptop, one after the other. They had the same data, the same API with the same simulated rule, the same build tool and the same typing. The cache was empty each time. The 1-minute load of the computer before the runs was between 4.6 and 16, because other work was running. So read only differences larger than the range of the passes; each JSON file has every pass.
- Fast
- Phone-like
Text description of the chart
On the fast profile, the right rows came after 1,041 ms for the starter, 1,058 ms for everything downloaded with a virtual list (“All”), and 600 ms for the finished page. On the phone-like profile: 3,758, 3,674 and 1,555 ms.
| Version | Right rows, fast | Right rows, phone-like | Wrong | Long tasks while typing (phone-like) | Data at the start |
|---|---|---|---|---|---|
| Starter | 1,041 ms | 3,758 ms | 0 | 1,245 ms | 381 kB |
| Everything, done well | 1,058 ms | 3,674 ms | 0 | 0 ms | 381 kB |
| Server, effect without cleanup | never | never | 5 of 5 | 0 ms | 3.1 kB |
| Server, TanStack Query | 614 ms | 1,661 ms | 0 | 0 ms | 3.1 kB |
| Finished | 600 ms | 1,555 ms | 0 | 0 ms | 3.1 kB |
What this tells us.
- The server wins the one measure. The finished page showed the right rows 42% sooner than the starter on the fast profile, and 59% sooner on the phone-like one.
- “Everything, done well” fixed the freeze, not the wait. With a virtual list, typing caused no long task, and a search after the download took 4.3 ms. But the visitor still waits for 381 kB before the first answer: 3.7 s on the phone-like profile. The download, not the drawing, decides this measure.
- The last two steps barely moved this measure. The virtual list and the split mattered for scrolling, clicks and the phone’s first rows, not for “open and type”. Each step answered its own number.
Part 7: new input, end to end
Section titled “Part 7: new input, end to end”The versions were built and tuned while typing paris. Does the result hold for a search that nobody tried? The course team ran the session measure once more with a new word, osaka. Its first letter, o, matches 8,899 airports, so it is another slow first answer:
| Version | Right rows for osaka, fast |
Phone-like | Wrong |
|---|---|---|---|
| Starter | 1,037 ms | 3,746 ms | 0 of 10 |
| Everything, done well | 1,046 ms | 3,646 ms | 0 of 10 |
| Finished | 611 ms | 1,548 ms | 0 of 10 |
Then follow one search through the whole system, in the finished page:
| Step | What happens | What proves it |
|---|---|---|
| The visitor opens the page | one request for the first page of the empty search, about 3 kB | the open group: one API request, 141 elements |
| The first rows are drawn | the details’ file starts to load | search:first-rows, then a second JavaScript file in the open group |
They type o, os … osaka |
one request per key; the old ones are closed | the requests sent and closed early in the type group |
The answer for osaka arrives |
its rows replace the empty search’s rows, and stay | data-results-for="osaka" 3 s later |
| They open an airport | the panel and map appear, without “Loading the map…” | the click group: under 50 ms |
What this tells us. The new word gave the same picture as paris: no wrong rows in the server versions, and the same order of the versions. The result is not a quirk of one search.
The recommendation
Section titled “The recommendation”Use the finished design for the website and for the agents’ desk. The server searches and pages. TanStack Query keeps each search apart and closes old requests. A virtual list draws the rows in view, and the map’s code comes after the first rows. On the course team’s laptop, it cut the time to the right rows from 1,041 to 600 ms, and from 3.8 to 1.6 s on the phone-like profile, with no wrong rows.
What it costs, said plainly to Nadia and Leo:
- A request per key press. A search after the last key took about 65 ms instead of a few. A short pause before sending, a debounce of about 150 ms, would cut the number of requests. It would not replace the cancellation, because a slow answer can still arrive late after a pause.
- The API must stay up. “Everything, done well” works offline once loaded. The server design does not.
- One more transition per click. About 48 ms per click instead of about 15 ms: invisible to a person, and visible in the numbers.
When the other way is right. “Everything, done well” is a fair choice when the data is small and fixed, the page stays open all day, and the network is fast. Then there is one wait in the morning, and instant searches after it. An office tool for 300 suppliers is such a case. The airport website is not.
Insights and limits
Section titled “Insights and limits”- Measure the version you would build, not a straw man. The starter lost by a lot. “Everything, done well” lost by less, and won one number. Only that comparison is fair.
- Fix the race in the code, not on your laptop. At full speed, the race did not show once in 10 runs. A test that answers out of order (
ResultList.test.tsx) catches it every time. - One change, one number. The server pages fixed the first rows and the data, the library fixed the race, the virtual list fixed the elements and the phone’s clicks, and the split fixed the phone’s first load. None of them fixed everything.
- A fix can cost something elsewhere. The first split made the first click ten times slower, and the finished split costs about 30 ms on every click.
- Limits of this study. One shared laptop, Chromium only, a simulated phone and a simulated server time, 9,051 rows, one word plus one new word. The server ran on the same computer, so there was no real network between them. Windows, Linux, Firefox, Safari and real phones were not tested.
Responsible use
Section titled “Responsible use”- The data has no guarantee. OurAirports says so, and volunteers edit it every day. Show the source and its date on the page, and do not use the list to plan a flight.
- Credit the source, even when the licence does not ask for it. The page’s header names OurAirports and links to it.
- Measure only your own services. The measurement script sends many requests. Point it at your own API on your own computer, never at OurAirports or at a service that you do not run.
- A search box is input. The API checks every parameter and answers
400for a bad one. React escapes the names that it draws, so a name with HTML in it is shown as text, not run. - Keyboard and screen readers. Each row is a button with its name, and the list is a labelled region that Tab can reach. A virtual list has costs here: the browser’s own search finds only the rows in the page. Accessible interaction and the case study Make an AI chat interface accessible show how to test this.
Make it a portfolio piece
Section titled “Make it a portfolio piece”This project shows what employers look for in a frontend engineer: a measure chosen before the code, honest numbers, a race found and fixed with a test, and a decision that names its costs.
What to put in the repository:
airport-search/ README.md what it is, how to run, test and measure it, your results table DATASET.md the source, the licence, the checksum, the changes, the limits LICENSE MIT, for the code docs/results.md your numbers: the computer, the build, the API mode, the medians api/ the search API and its 11 checks src/ the page and its 6 tests measure/ measure.mjs and its four groups data/airports.csv the fixed copy (public domain)- Make a new Git repository from your project folder, and push it to GitHub.
.gitignorekeeps outnode_modules/,dist/andresults/. - Fill in
docs/results.mdwith your own runs and your computer, and link it from the README. - Describe it in two sentences: “A search page over 9,051 airports with a small Node.js API. I compared the versions under one measure and fixed a stale-response race that appeared 10 times out of 10. The time to the right rows on a phone-like profile fell by more than half.”
Go further: add a debounce, and measure the requests that it saves. Add the country filter that the API already has. Run the measurements on a real phone over Wi-Fi, with Chrome’s remote debugging.
Knowledge check
Section titled “Knowledge check”Check your understanding
With the API at full speed, the effect without cleanup showed the right rows in 10 runs out of 10. A teammate says that the race is not a real problem. What do you answer?
Show the answer
The race is in the code: the effect shows whichever answer arrives last. At full speed, every answer took a few milliseconds and arrived in order, so the bug stayed hidden. With a server time that grows with the matches, the answer for “p” arrived last in 10 of 10 runs. A real server, a busy moment or a phone network does the same. The fix is a cleanup or TanStack Query’s key and signal, and a test that answers out of order proves it.
Does your answer have the main points of ours?
Sign in and enroll in the course to save your answers. Every check counts toward the certificate.
Check your understanding
After its download, the starter showed the rows for 'paris' about 3 ms after the last key; the finished page needed about 65 ms. Why does the recommendation still choose the server?
Show the answer
Because the one measure starts when the page opens. The starter must first download 380 kB and draw every row: the right rows came after about 1 s on the fast profile and 3.8 s on the phone-like one. The finished page needed about 0.6 s and 1.6 s. Even “everything, done well”, with a virtual list, waited 3.7 s on the phone-like profile. The 65 ms after the last key is the price of the server, and it is far smaller than the download.
Does your answer have the main points of ours?
Sign in and enroll in the course to save your answers. Every check counts toward the certificate.
Check your understanding
The first try at code splitting made the first click on an airport take over 300 ms, even on a fast network. What were the causes, and which two changes fixed it?
Show the answer
The panel’s code was not loaded yet, so the new <Suspense> boundary showed its fallback. Then React waited until 300 ms had passed since the fallback appeared before it showed the panel. The fix has two parts. Load the file after the first rows, so that it is there before the click. And change the chosen airport inside startTransition(), in a boundary that is already on the screen. React then keeps the old panel instead of showing the fallback. The first click fell to about 48 ms.
Does your answer have the main points of ours?
Sign in and enroll in the course to save your answers. Every check counts toward the certificate.
Recap
- You chose one measure first: the time from opening the page to the right rows for a typed word, on a fast and a phone-like profile.
- The prototype downloaded 380 kB and drew up to 54,338 elements. Its searches were instant after the download, but the page froze while you typed.
- Server pages made the first answer small, and brought the stale-response race: wrong rows 10 times out of 10. TanStack Query’s key and signal fixed it.
- A virtual list kept the page at about 140 elements. Code splitting helped the phone’s first load, after one fix for React’s pause.
- The finished page showed the right rows in about 0.6 s instead of 1 s, and 1.6 s instead of 3.8 s on the phone-like profile. “Everything, done well” stayed slow to start.
Next, the second case study makes an AI chat interface usable with a keyboard and a screen reader.