
Measure the browser
- Lesson 14
- 55 min
- Module 5: Performance and scalability
Lesson 14 of 19 · Frontend Architecture and Performance for AI AppsMeasure the browser
1. Web foundations bridge
2. Components and application structure
3. Data fetching and state management
4. AI-specific interaction states
5. Performance and scalability
6. Security, accessibility and handoff
What you will be able to do
Omar says that the ticket desk feels slow on his phone. Before you change any code, find out which wait he feels: the download, the work in the browser, or the API. This lesson measures all three, with the browser’s own tools and with numbers.
Before you startWhat to know and to have ready
What you need to know
- Components, props, state and why React draws a component again, from Rendering and effects.
- The ticket list in pages of 50, from Pagination and forms.
- The streamed draft and its pieces of text, from Streaming interfaces.
What you need on your computer
- Your project
~/projects/ticket-deskat the end of Module 4:npm testprintspass 21andTests 40 passed (40). If it does not, copy the snapshotend-of-m04, as the labs README shows. - Chrome or Edge. Their developer tools (DevTools) are the same, because both are built on Chromium. Firefox has the same tools under slightly different names.
- Optional: the React Developer Tools extension for your browser, for its Profiler tab.
Tested with Node.js 24.18.0 and npm 11.16.0 on macOS (Apple silicon), in Chromium 156. The Windows (PowerShell) and Linux commands are written out but were not run.
A slow restaurant
Section titled “A slow restaurant”You order a meal, and it arrives 40 minutes later. Who was slow? Perhaps the waiter took your order late. Perhaps the kitchen was full. Perhaps the plate was ready in 10 minutes and then waited on the counter for 25.
A new manager who buys a faster oven fixes nothing if the plates waited on the counter. A good manager first writes down the time of each step for a few orders: order taken, cooking started, plate ready, plate on the table. Then the slow step is visible, and the manager changes only that step.
A web page is the same. The agent clicks, and something happens later. Between the click and the screen, there are several steps. Each one can be the slow one.
The problem: a fix before a measurement
Section titled “The problem: a fix before a measurement”Omar’s message is short: “The desk feels slow on my phone.” Tomás answers at once: “React draws too often. Let’s wrap every component in memo. Memoize everything.”
You met memo and this measurement in Rendering and effects: memo tells React to skip a component whose props did not change. Sam repeats the measurement with a lab page that you add in this lesson. The page has a note box above 50 ticket rows. Sam types 20 characters in the note and counts how often React draws the rows.
| Where the note’s text lives | Rows drawn again | Time in React for 20 key presses |
|---|---|---|
| In the component that also draws the rows | 1,000 | 2.4 ms |
The same, with every row in memo |
0 | 0.7 ms |
| In a small note component of its own | 0 | 0.4 ms |
memo saved 1.7 ms for 20 key presses: less than 0.1 ms per key, against about 16.7 ms between two pictures on the screen. Moving the state down saved more, with no memo at all.
So Tomás’s fix makes the code longer and saves nothing that Omar can feel. It answers a question that nobody measured. This course calls the mistake optimizing before you measure the real bottleneck. The bottleneck is the one step that limits the whole wait, like the counter where the plates waited.
The idea: three kinds of wait
Section titled “The idea: three kinds of wait”Everything between the agent’s action and the result on the screen is a user-visible delay. For the ticket desk, it comes from three kinds of wait:
- Download. Bytes travel over the network: the HTML, the JavaScript, the CSS, the API’s JSON. On a fast office network this is short. On a phone with a weak signal, it can be most of the wait.
- Work in the browser. The browser runs the JavaScript. React decides what changed, then the browser lays out the page and paints it. A slow phone does this work several times slower than a laptop.
- Wait for the API. The request goes to the server, the server works, and the answer comes back. The browser only waits.

Text description of the diagram
The diagram shows the six steps of the desk’s first load. First the browser asks for the page. The HTML arrives, but it holds only an empty element with the ID root. Then the JavaScript arrives: React, the libraries and the desk’s own code. The browser runs it, and React draws the frame of the page. The code asks the API for 50 tickets and waits for the JSON. Last, React draws the rows. Steps 1 to 3 are downloads, measured with the Network panel and the size report. Steps 4 and 6 are work in the browser, measured with the Performance panel and the React Profiler. Step 5 is the wait for the API, measured with the Network panel.
The browser can tell you when each step happened. It records the moments of a page load in the Performance API, a set of timers that every page can read in JavaScript. Three of its moments matter here:
- First Contentful Paint (FCP): the first time the screen shows any text or image. For the desk, that is the heading and “Loading tickets…”.
- Largest Contentful Paint (LCP): the moment the largest text block or image appeared. Browsers use it as a sign that the main content is there.
- DOMContentLoaded: the HTML is read and the scripts in it have run.
None of these knows what an agent needs. “Loading tickets…” is content for FCP, but not for Grace’s agents. So the desk sets its own moment, a mark, the first time that ticket rows are on the screen. You add it in the guided practice:
performance.mark('tickets:first-rows');The course calls this moment first rows. It is the number to watch for Omar’s complaint.
A tiny example: one first load, step by step
Section titled “A tiny example: one first load, step by step”Here is one first load of the desk after this lesson’s changes, measured by the course team. The browser pretended to be a phone. The network was slowed to what Chrome calls “Slow 4G”: 150 ms for each round trip, 1.6 Mbit/s down and 750 kbit/s up. The computer was slowed to a quarter of its speed. These are the phone settings of Lighthouse, Google’s tool that checks web pages.
The chart shows each request as a bar, from the moment the browser asked to the moment the last byte arrived. A chart like this is a waterfall, because the bars run down from the top left, like water down steps.

Text description of the diagram
The waterfall has four bars. The page itself, 0.7 kB of HTML, takes from 0 to 157 ms. The JavaScript file index.js, 87.1 kB on the network, takes from 163 to 751 ms: it is the longest bar by far. The CSS file, 1.8 kB, arrives at the same time, by 336 ms. After a gap, the API request for 50 tickets runs from 839 to 1,065 ms. Three vertical lines mark DOMContentLoaded at 786 ms, FCP at 840 ms and first rows at 1,074 ms.
Read it from the top, with every number:
- 0 to 157 ms: the HTML page, 0.7 kB. Almost all of this time is the round trip of 150 ms.
- 163 to 751 ms:
index.js, 87.1 kB. This is the longest bar: 588 ms. The CSS, 1.8 kB, arrives at the same time. - 751 to 839 ms: no bar. The browser runs the JavaScript, and React draws the frame of the page. FCP comes at 840 ms: the heading and “Loading tickets…”.
- 839 to 1,065 ms: the request for 50 tickets, 226 ms. Of this, 150 ms is the round trip.
- 1,074 ms: first rows. React needed about 9 ms to draw them.
Now check the longest bar with arithmetic. The JavaScript file is 87.1 kB on the network. One kB is 1,000 bytes, and one byte is 8 bits, so that is 697 kilobits. At 1.6 Mbit/s, about 1,600 kilobits per second, it needs about 0.44 seconds. Add one round trip of 0.15 seconds, and you get about 0.59 seconds. The waterfall shows 588 ms.
So, of the 1,074 ms before first rows, the downloads take 745 ms: the HTML and the JavaScript. The API takes 226 ms, running the JavaScript about 88 ms, and drawing the rows about 9 ms. On this phone, the download is about two thirds of the wait. That is where to look first, in the next lesson. React’s work for 50 rows is not the problem.
The size report: what the JavaScript holds
Section titled “The size report: what the JavaScript holds”Before the browser downloads a text file, the server usually compresses it with gzip. The browser unpacks it again. So a file has two sizes. The size on the network (gzip) sets the download time. The unpacked size is what the browser must read and run. Vite prints both after every build:
dist/index.html 0.39 kB │ gzip: 0.26 kBdist/assets/index-Cq7Ckq9E.css 4.20 kB │ gzip: 1.48 kBdist/assets/index-D3f2JW_V.js 286.02 kB │ gzip: 87.72 kBThe whole desk is one JavaScript file: 286 kB unpacked, 87.7 kB on the network. What is in it? The course team built the finished desk with one file per package and measured each one. The packages below have the same versions in your project now:
Text description of the chart
The size on the network of the packages in the desk’s JavaScript: react-dom 64.1 kB, TanStack Query’s core 9.5 kB and its React part 4.1 kB. React’s DOM package alone is about three quarters of the 87.7 kB file.
react-dom alone is 64.1 kB of the 87.7. The desk’s own code, with all its screens and labs, is a small part. So a smaller first download must leave out code that the first screen does not need, and it cannot leave out React. The next lesson does exactly this.
Rendering time: the React Profiler and the labs
Section titled “Rendering time: the React Profiler and the labs”The Performance panel of DevTools records everything the browser does: scripts, layout, paint. React adds its own view. The React Profiler records each time React draws (a commit) and how long each component took.
React’s normal production build removes the timing code to stay small and fast. React’s development build keeps it, but it runs extra checks and is slower, so its times mislead. The profiling build is the middle way: production speed, with the timing code. You add a script for it in the guided practice, npm run build:profile. The desk’s labs use React’s <Profiler> component to count commits and time, and they write the numbers on the page.
The component update trace
Section titled “The component update trace”This diagram follows one key press in the note box of the rerender lab. Orange components are drawn again; dashed ones are not.

Text description of the diagram
The diagram shows the same screen built in three ways. On the left, the state is too high. The component that holds the note also draws the rows, so every key press draws it, the input, the list and all 50 rows again. For 20 key presses, that is 1,000 row renders and 2.4 ms in React. In the middle, the rows are wrapped in memo. The parent and the list are still drawn. React skips the 50 rows, because their props did not change: 0 row renders, 0.7 ms. On the right, the note lives in its own small component, NoteBox. A key press draws only NoteBox and its input; the list is not touched at all: 0 row renders, 0.4 ms.
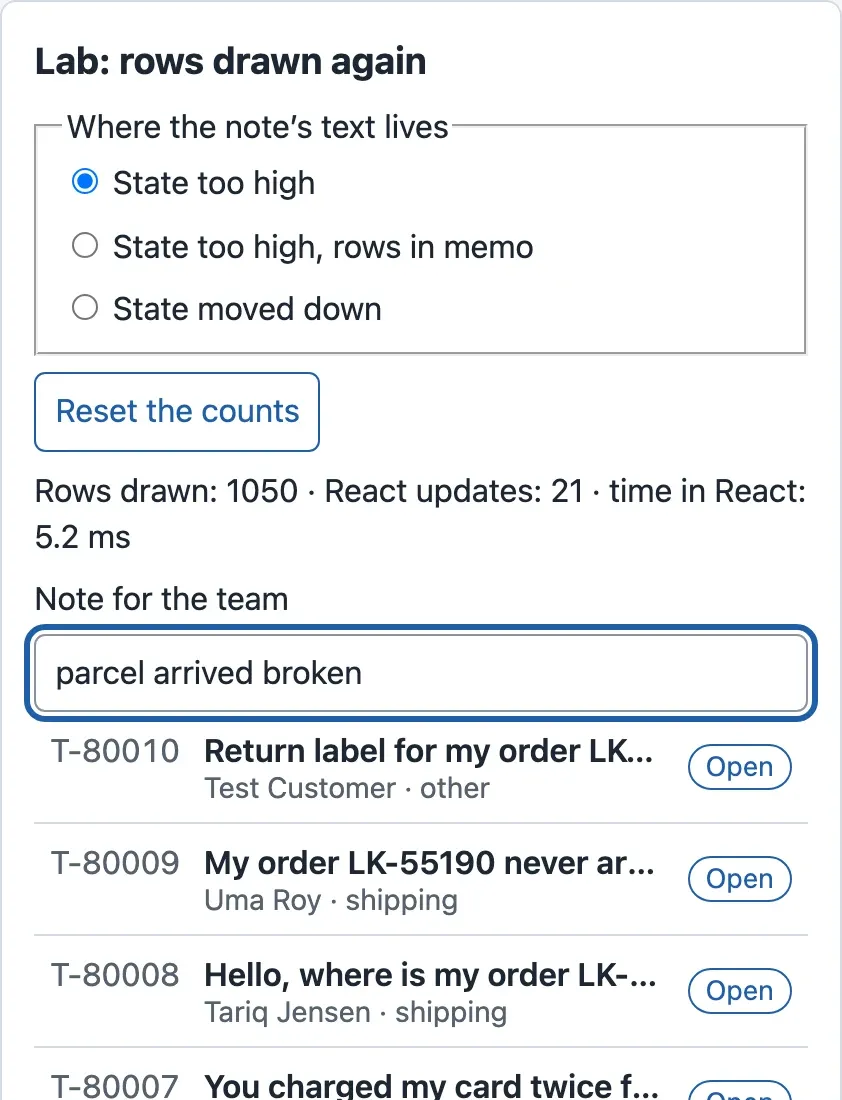
This is the rerender lab on the course team’s laptop, after typing 21 characters with the state too high:
Every piece of a stream
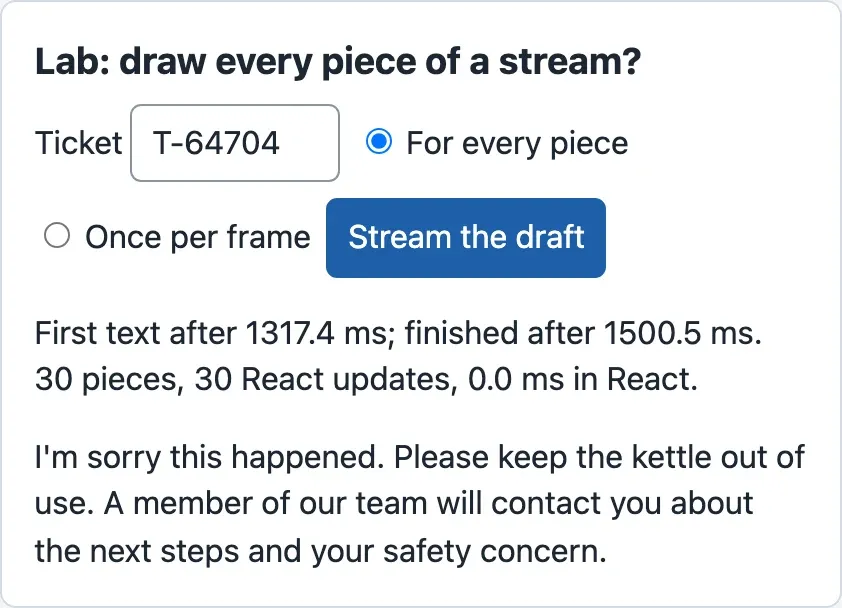
Section titled “Every piece of a stream”The stream lab asks a similar question about the AI draft. The mock API sends the recorded draft of ticket T-64704 in 30 pieces of text. The lab draws the text again for every piece, or once per screen frame (the pieces that arrived during one frame together).
Text description of the chart
React commits for one whole draft. Ticket T-64704, 30 pieces: 30 commits when the text is drawn for every piece, 11 when it is drawn once per frame. Ticket T-80008, 28 pieces: 28 against 12. React’s time for a whole draft was below 0.01 ms in every case.
Drawing once per frame cuts the commits by more than half. But React’s work for the whole draft was below 0.01 ms either way. The CPU is not a reason to change anything here. There is a real reason not to react to every piece, but it is a person, not a processor: a screen reader that reads every piece aloud. That is the subject of Accessible interaction in Module 6.
Guided practice: measure your desk
Section titled “Guided practice: measure your desk”You add four tools to the project: a size report, a profiling build, the first-rows mark and two labs. Then you measure a phone-like first load in DevTools. Work in ~/projects/ticket-desk. Keep the mock API running in a first terminal (npm run api) and use a second terminal for the commands.
-
Open
package.json. In"scripts", after the"test"line, add two lines. Put a comma at the end of the"test"line."build:profile": "tsc --noEmit && vite build --mode profile","size": "node scripts/bundle-report.mjs" -
Copy the size report from the snapshot
end-of-m05. The commands assume that the labs repository is next to your project, in~/projects.Terminal window mkdir -p scriptscp ../nextia-learning-labs/C22/snapshots/end-of-m05/scripts/bundle-report.mjs scripts/Terminal window New-Item -ItemType Directory -Force scriptsCopy-Item ..\nextia-learning-labs\C22\snapshots\end-of-m05\scripts\bundle-report.mjs scripts\The script reads every file in
dist/, compresses each one with gzip and prints both sizes. -
Replace
vite.config.tswith this version. The new line uses React’s profiling build only when the build runs with--mode profile:import { defineConfig } from 'vitest/config';import react from '@vitejs/plugin-react';// `vite build --mode profile` builds the production code with React's profiling build, so that// the React DevTools Profiler (and <Profiler>) can measure a production build.export default defineConfig(({ mode }) => ({plugins: [react()],resolve: mode === 'profile' ? { alias: { 'react-dom/client': 'react-dom/profiling' } } : {},server: { port: 5173, strictPort: true },preview: { port: 4173, strictPort: true },test: {environment: 'jsdom',include: ['src/**/*.test.{ts,tsx}'],setupFiles: ['src/test/setup.ts'],},})); -
In
src/features/tickets/TicketList.tsx, importuseEffecttoo:import { useEffect, useState } from 'react';. Then add the mark after the lineconst tickets = …:// A mark for the browser's performance tools: the first time that ticket rows are on the screen.const firstRows = tickets.length > 0;useEffect(() => {if (firstRows && performance.getEntriesByName('tickets:first-rows').length === 0) performance.mark('tickets:first-rows');}, [firstRows]);The check sets the mark only once, at the first rows.
-
Copy the two labs, their test and their timing helper from the snapshot:
Terminal window for f in measure.ts RerenderLab.tsx RerenderLab.test.tsx StreamLab.tsx; docp ../nextia-learning-labs/C22/snapshots/end-of-m05/src/labs/$f src/labs/doneTerminal window foreach ($f in 'measure.ts','RerenderLab.tsx','RerenderLab.test.tsx','StreamLab.tsx') {Copy-Item ..\nextia-learning-labs\C22\snapshots\end-of-m05\src\labs\$f src\labs\} -
In
src/labs/LabsPage.tsx, import the two labs and add them toLABS, after thejobline:import { RerenderLab } from './RerenderLab';import { StreamLab } from './StreamLab';rerender: { title: 'Rows drawn again', Lab: RerenderLab },stream: { title: 'Draw every piece of a stream?', Lab: StreamLab }, -
Run the tests:
npm test. The two new tests check the rerender lab: with the state too high, 5 key presses draw the 50 rows 250 times; with the state moved down, 0 times. -
Build, then run the size report:
Terminal window npm run buildnpm run size -
Start the production build:
npm run preview. Open http://localhost:4173/ in Chrome or Edge. -
Open DevTools (F12, or Cmd+Option+I on a Mac). In the Network panel, select Disable cache, and in the throttling menu choose Slow 4G. In the Performance panel, open its settings (the gear) and set CPU to 4× slowdown.
-
Reload the page. In the Network panel, look at the Waterfall column and the Size column of
index-….js. -
In the Console panel, type
performance.getEntriesByName('tickets:first-rows')[0].startTimeand press Enter. -
Stop the preview (Ctrl+C). Run
npm run build:profile, thennpm run previewagain. Open http://localhost:4173/#/labs/rerender, type 20 characters in the note, and read the counts. Do the same with the other two choices. -
Open http://localhost:4173/#/labs/stream and stream T-64704 both ways.
-
Set the network throttling and the CPU back to No throttling. DevTools keeps them while it is open.
Show the expected result
Step 7:
ℹ pass 21 Tests 42 passed (42)Step 8, the course team’s run (your file names have the same hashes if your files are the same):
dist/index.html 0.39 kB │ gzip: 0.26 kBdist/assets/index-Cq7Ckq9E.css 4.20 kB │ gzip: 1.48 kBdist/assets/index-D3f2JW_V.js 286.02 kB │ gzip: 87.72 kB✓ built in 305msFile Size Gzipassets/index-D3f2JW_V.js 279.3 KB 84.6 KBassets/index-Cq7Ckq9E.css 4.1 KB 1.4 KBindex.html 0.4 KB 0.3 KBJavaScript: 1 files, 84.6 KB gzip in allThe two tools disagree a little, and both are right. Vite counts 1 kB as 1,000 bytes. The size report counts 1 KB as 1,024 bytes and uses gzip’s strongest setting, as many servers do. Always compare a size with a size from the same tool.
Step 9 prints ➜ Local: http://localhost:4173/.
Step 11: after the page come three requests: index-….js of about 87 kB, the CSS file and tickets?limit=50. The API request starts only after the JavaScript has arrived and run. The JavaScript bar is the longest one, as in the waterfall above.
Step 12, the course team’s run with Slow 4G and 4× CPU:
1074.8999999999069Your number will differ. It is a time in milliseconds since the page started to load.
Step 13, on the course team’s laptop, after typing the 21 characters “parcel arrived broken” in each version:
Rows drawn: 1050 · React updates: 21 · time in React: 5.2 ms (state too high)Rows drawn: 0 · React updates: 21 · time in React: 1.4 ms (rows in memo)Rows drawn: 0 · React updates: 21 · time in React: 0.3 ms (state moved down)One React update per key; with the state too high, 50 rows each time (21 × 50 = 1,050). The times come from one run while screenshots were taken, so they differ from the medians in the table at the top. The counts do not change from run to run.
Step 14:
First text after 1317.4 ms; finished after 1500.5 ms. 30 pieces, 30 React updates, 0.0 ms in React.First text after 1316.6 ms; finished after 1500.8 ms. 30 pieces, 11 React updates, 0.1 ms in React.The first line is “For every piece”, the second “Once per frame”.
Your turn: the same load without the phone
Section titled “Your turn: the same load without the phone”Predict first. Without throttling, on your computer’s normal network, will first rows come 2 times sooner, 5 times or 10 times? Which bar of the waterfall shrinks the most? Set No throttling for the network and the CPU, reload three times, and read the mark in the Console each time.
Show the answer
On the course team’s laptop, without throttling, first rows came after 97.4 ms (the median of 5 runs, from 91.1 to 98 ms). With the phone-like profile, they came after 1,073.6 ms. So the phone-like load is about 11 times slower.
The JavaScript bar shrinks the most. Without throttling, index.js arrived about 11 ms after the page started, instead of 751 ms, because it travelled over a local connection. What is left is mostly the work of the browser and the API’s answer. This is why a measurement on your own laptop says little about Omar’s phone: always say under which conditions you measured a number.
Common mistake
Measuring the development server
Symptom: Sam measures with npm run dev, the server that Vite uses while you write code. In the Network panel, the first load of the desk now makes 48 requests instead of 4 (the page, one JavaScript file, one CSS file and the API). On the course team’s laptop, without any throttling, first rows came after 153.1 ms (median of 5 runs, after a first visit). The production build took 97.4 ms. Sam reports: “The desk needs 150 ms even on a laptop, so React must be slow.”
Cause: the development server sends every source file as its own module, without bundling, so the page makes many small requests. It also uses React’s development build, which runs extra checks and is slower. Those numbers describe the tool that you write code with, not the desk that agents use.
Fix: always measure a production build: npm run build, then npm run preview. For the React Profiler, use npm run build:profile. Write down how you measured: the build, the throttling, and how many runs.
Consequence in AI work: an interface for AI features often feels slow while you build it, because the model’s answer is slow too. If you measure the wrong build, you can spend days on the wrong part. Meanwhile the real wait, the model or the download on a phone, stays the same.
When to measure what, and what it costs
Section titled “When to measure what, and what it costs”| The question | The tool | What to read |
|---|---|---|
| What does the browser download? | npm run size, the Network panel |
The size on the network (gzip) of each file |
| When does the agent see useful content? | A mark such as tickets:first-rows, read in the Console or by a script |
The mark’s time, under stated conditions |
| Is the browser busy? | The Performance panel | Long blocks of script, layout or paint |
| Does React draw too much? | The React Profiler, the labs, a profiling build | Commits, and which components were drawn |
| Is the API slow? | The Network panel: the request’s timing | The wait for the first byte of the answer |
Measuring has costs too. Times change from run to run, so the course team ran each measurement 5 times and reports the median, the middle value. Other programs on the computer change the numbers. The course team’s numbers come from a laptop with other work running; yours will differ, but the shapes stay. A laptop that pretends to be a phone is not a real phone. It is a fair way to compare two versions, not a promise about Omar’s device. Teams that need the truth about real users collect the same marks from real browsers and send them to a server. This is called real-user monitoring, and it is outside this course.
The rule of this module is simple: measure, change one thing, then measure again in the same way.
Knowledge check
Section titled “Knowledge check”Check your understanding
Tomás wants to wrap every component in memo, because the desk feels slow on Omar's phone. What do you measure before you answer him, and what did the measurements of this lesson show?
Show the answer
First measure where the wait goes, under phone-like conditions: a production build, Slow 4G and a 4× slower CPU, with the first-rows mark and the waterfall. The waterfall showed that the download of the JavaScript is the largest part of the wait on a phone. memo changes none of it. The rerender lab showed that memo saved 1.7 ms for 20 key presses, which nobody can feel. Moving the note’s state down removed the same drawings without memo.
Does your answer have the main points of ours?
Sign in and enroll in the course to save your answers. Every check counts toward the certificate.
Check your understanding
Predict: FCP says 900 ms and the first-rows mark says 1,150 ms. What did the agent see between the two moments, and which number do you report to Omar?
Show the answer
At FCP, the browser painted the first text: the heading, the filters and “Loading tickets…”. The rows came 250 ms later, after the API answered and React drew them. Report the first-rows mark, because it is the moment the agent can work. FCP only says that something is on the screen.
Does your answer have the main points of ours?
Sign in and enroll in the course to save your answers. Every check counts toward the certificate.
Check your understanding
Your size report says 84.6 KB for index.js and Vite says 87.72 kB. A teammate says one tool is wrong. What do you answer?
Show the answer
Both are right; they count differently. Vite uses 1 kB = 1,000 bytes. The size report uses 1 KB = 1,024 bytes and gzip’s strongest setting. Compare sizes only from the same tool, run in the same way.
Does your answer have the main points of ours?
Sign in and enroll in the course to save your answers. Every check counts toward the certificate.
Recap
- A user-visible delay has three kinds of wait: the download, the work in the browser, and the wait for the API. Find the largest one before you change code.
- The desk’s own mark,
tickets:first-rows, says when an agent can work. FCP and LCP say only that something was painted. - On a phone-like profile, the download of the one 87.7 kB JavaScript file was the largest part of the first load.
react-domalone is 64.1 kB of it. memosaved 1.7 ms for 20 key presses; moving the state down did the same withoutmemo. Drawing a streamed draft for every piece cost React less than 0.01 ms.- Measure a production build (or the profiling build for React’s numbers), never the development server. Write down the conditions, and take the median of several runs.
Next, you make the first download smaller and the long list cheaper to draw, and you measure each change in the same way.
Next: Load less work