
Quality and costs
- Lesson 9
- 55 min
- Module 3: Instrument useful telemetry
Lesson 9 of 19 · MLOps and LLMOps: Operating AI in ProductionQuality and costs
1. Define operational ownership
2. Version and reproduce the system
3. Instrument useful telemetry
4. Monitor changing behaviour
5. Release and improve safely
6. Handle incidents and handoff
What you will be able to do
One cost number and one failure count for the whole service cannot say which prompt costs more, or why tickets fail. Count outcomes, failure kinds, tokens and cost for each prompt version, and find the slow, expensive step inside a single trace.
Before you startWhat to know and to have ready
What you need to know
- Logs, metrics and traces: the
ticket.triagedevent, the GenAI attributes andops waterfall. - Answers cut off at the token limit (
finish_reason: length) from Handle incomplete results, and hidden reasoning tokens from Reasoning and multimodality. - The evaluation course’s comparison of prompt v2 and v3, from Trade-offs and regressions.
What you need on your computer
- Your project at the snapshot
end-of-m03, with the saved telemetry indata/telemetry/. No Docker: every command in this lesson reads files.
A bakery tries a new recipe
Section titled “A bakery tries a new recipe”A bakery bakes bread with its usual recipe. One morning, half of the trays use a new recipe, which needs less flour. In the evening, the owner reads one report: 8% of the loaves went in the bin, and flour cost more than usual.
What does that say about the new recipe? Nothing. The report mixes the two recipes, so the owner cannot see that the old one wasted almost nothing. “In the bin” also mixes reasons: burnt, not risen, dropped on the floor. Each reason has a different cause and a different person who can fix it.
A good report splits the counts by recipe and by reason. And it puts the cost next to each loaf, also for the loaves in the bin: the bakery paid for their flour too.
The problem: one number for two prompts
Section titled “The problem: one number for two prompts”Omar wants the cheaper prompt. Prompt v3 is shorter than v2, so each request sends fewer tokens. “It must cost less,” he says.
Here is what last week’s dashboard could say, from Service objectives:
Cost: US$0.440 per 1,000 tickets (budget US$0.40, OVER)The cost is over the budget, but this number mixes 602 tickets of prompt v2 and 1,798 of prompt v3. It cannot tell Omar which prompt costs more. The draft SLI said that 197 tickets got no answer, but not which prompt failed, or how. A ticket can fail because the model wrote nothing, or because the provider never answered. These are different problems, with different owners.
The idea: count by version, by outcome, with the cost next to it
Section titled “The idea: count by version, by outcome, with the cost next to it”Three changes turn the bakery’s report into a useful one, and they work the same way for the assistant.
Label every count with the version. Every ticket.triaged event and every metric carries prompt.version and release.id. Then any number can be split by version. In Grafana, a label becomes a line per version; in ops, a column per version.
Name the outcome of each ticket. A task outcome says whether the triage step did its job for this ticket: ok when the answer had a valid team, decision and draft. Every other value is a failure category: a named kind of failure, with its own cause:
| Outcome | What happened | Who looks first |
|---|---|---|
no_answer |
The model used all its tokens and wrote no text (finish_reason: length) |
Priya (the prompt) |
bad_answer |
Text that is not a valid decision | Priya |
rejected |
The provider refused the request | Kwame (the provider) |
dead_letter |
The provider failed every attempt: timeouts, errors | Amira, then Kwame |
failed |
Anything else, for example a missing ticket | Amira |
Attribute the cost. Cost attribution means putting each cost on the thing that caused it: on the AI call, then on its ticket, then on the version. The span of each call has its tokens and app.cost_usd. The ticket’s event adds up its calls. A ticket that fails still has its cost, because the provider bills tokens, not good answers.
A tiny example: four tickets by hand
Section titled “A tiny example: four tickets by hand”Here are four tickets from last week’s replay, two for each prompt. The tokens are pasted from the spans of their triage calls. The course’s assumed prices are US$0.10 per million input tokens and US$0.50 per million output tokens. So each call costs input tokens × 0.10 + output tokens × 0.50, in millionths of a dollar.
| Ticket | Prompt | Outcome | Tokens in | Tokens out (reasoning) | Cost |
|---|---|---|---|---|---|
| T-502401 | v2 | ok | 1,903 | 235 (143) | 190.3 + 117.5 = US$0.000308 |
| T-502746 | v2 | no_answer | 1,922 | 1,000 (1,000) | 192.2 + 500.0 = US$0.000692 |
| T-503003 | v3 | ok | 1,467 | 621 (477) | 146.7 + 310.5 = US$0.000457 |
| T-503354 | v3 | no_answer | 1,495 | 1,000 (1,000) | 149.5 + 500.0 = US$0.000650 |
Read it column by column. Prompt v3 sends about 430 fewer input tokens: Omar is right about that. But its good answer has 621 output tokens, against 235 for v2. Output tokens cost five times as much as input tokens here, so v3’s good answer costs 48% more than v2’s.
Now look at the two no_answer rows. They are the most expensive tickets of the four. Each call spent all 1,000 output tokens on reasoning tokens: the model’s hidden work before it writes the answer. The provider counts and bills them, but it does not return their text. The limit stopped the call before the model wrote anything, so these tickets cost the most and gave nothing.
Last, the outcome. With two tickets per prompt, each prompt has one failure. That is a 50% failure rate for both, and it says nothing. You need many tickets, split by version, to see a difference.
Larkfield: last week, split by prompt
Section titled “Larkfield: last week, split by prompt”The ops quality command does the same table for every ticket in a file:
python -m ops quality data/telemetry/release-full.jsonl.gzprompt assistant-v2 assistant-v3------------------------------ ----------------- -----------------tickets 602 1,798 ok 601 (99.8%) 1,602 (89.1%) no_answer 1 (0.2%) 186 (10.3%) dead_letter 0 (0.0%) 10 (0.6%)sent to a person 162 (27.0% of ok) 475 (29.7% of ok)tokens in (median) 1,902 1,477tokens out (median) 260 627triage call p50 / p95 (s) 2.89 / 5.17 5.56 / 8.34time to a draft p95 (s) 5.2 7.9cost per 1,000 tickets (US$) 0.338 0.474agrees with the agent's review 288/307 (93.8%) 623/744 (83.7%)Now Omar’s question has an answer. Per 1,000 tickets, v3 costs US$0.474 and v2 costs US$0.338: 40% more. The median call of v3 sends 425 fewer input tokens, which saves US$0.0000425. It also writes 367 more output tokens, which cost US$0.0001835. The extra output costs four times what the shorter prompt saves.
The failures have names too. One ticket in ten with v3 got no answer, against one in 602 with v2 (the “spark plug” recording). Ten v3 tickets became dead letters: provider errors, not answers without text. The triage call is almost twice as slow at the median (5.56 s against 2.89 s), and 61% slower at p95. And when agents later checked the decisions, they agreed with v3 less often.
Other splits use the same command. --by release gives the same two columns under the release IDs 1.5.0-4fafd1 and 1.5.0-767b56, from Artifact lineage. --from 5 keeps the tickets received from minute 5 onward, after the switch. --by evidence separates replayed answers from the 10 dead letters, which have no answer at all.
The same numbers in Grafana
Section titled “The same numbers in Grafana”The AI quality dashboard puts four signals at the top. Here is the normal week, and then last week:


These panels count a window of recent tickets, for every prompt together. Use them to see that something is wrong now. Then use the panels with one line per version to see which version it is:
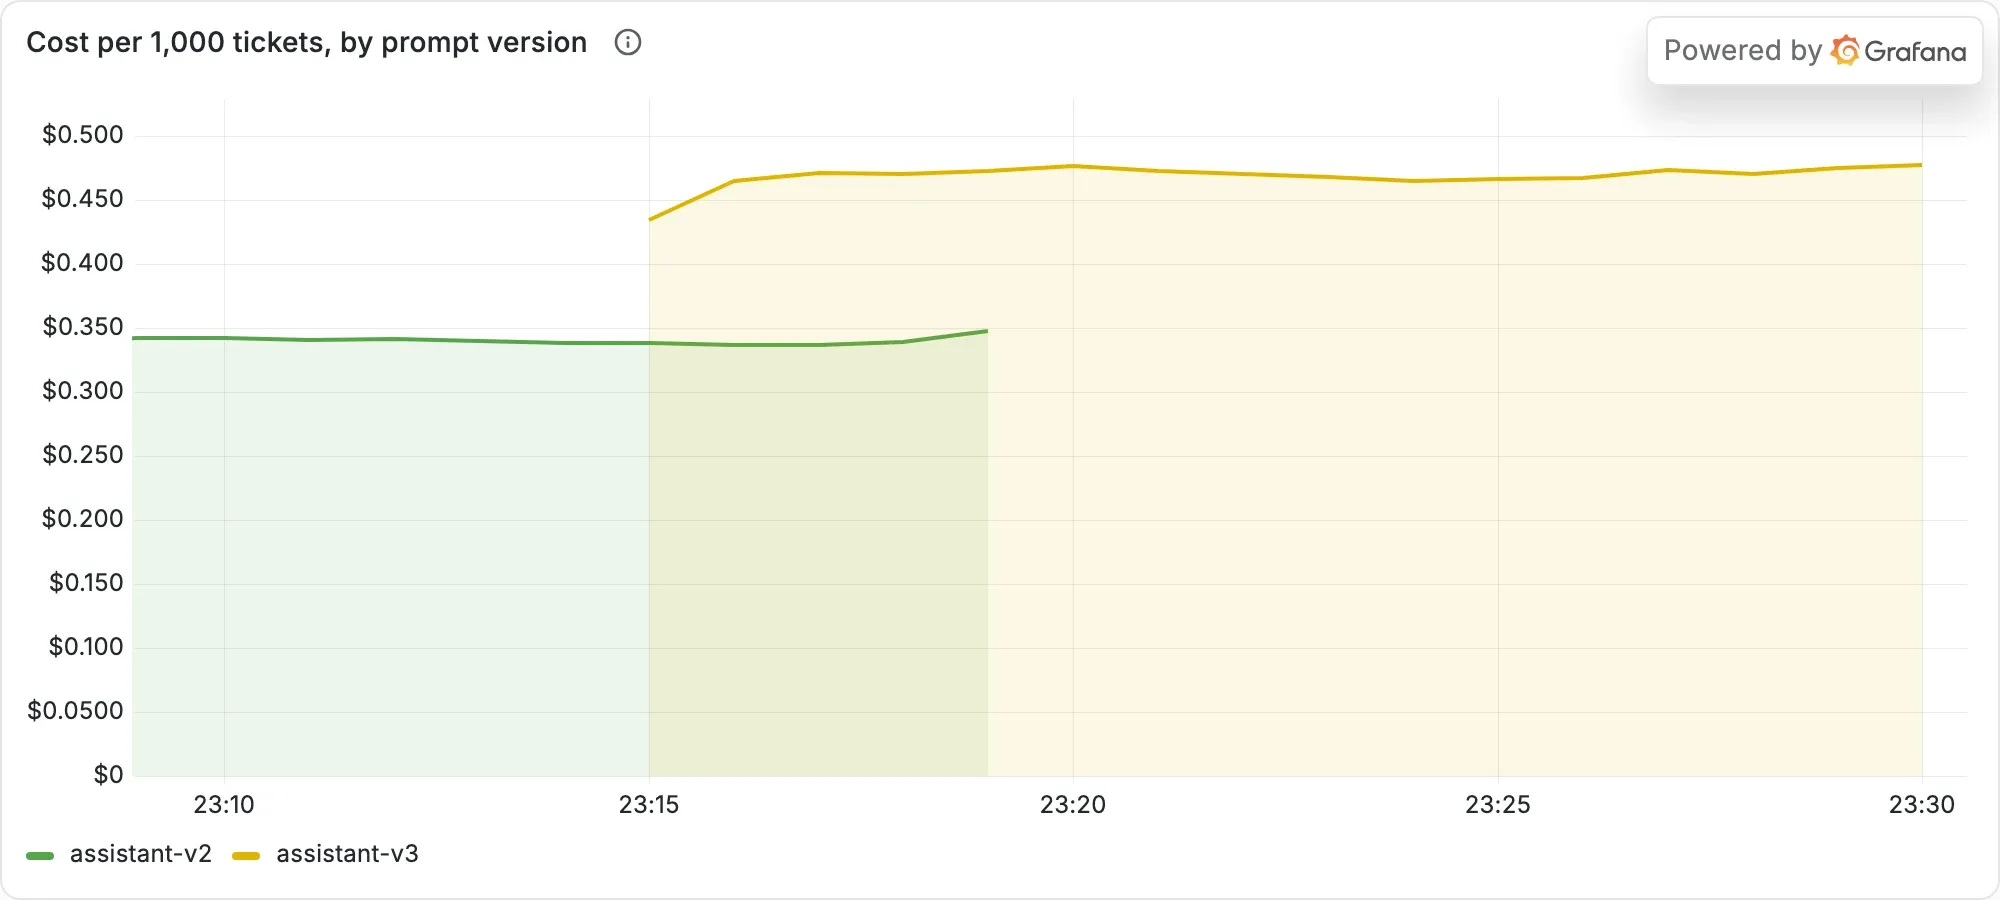
The two lines never meet: v3 costs more from its first minute. Without the prompt.version label, this panel would show one line that moves up slowly, and nobody would know why.
An alert that cannot fire
Section titled “An alert that cannot fire”Labels have a trap, and the course team fell into it. Grafana’s metrics store, Prometheus, measures a counter’s increase over a window. A new combination of labels starts a new series. When the first no_answer of a new prompt arrived, its series started at 1. Prometheus had no earlier value to compare, so the increase was 0. In the first practice canary, one answer had no text, and the no-answer alert never fired.
The fix is in ticket_api/telemetry.py: when the worker sees a new prompt and release, it adds 0 to every outcome series first (zero_series). The first real failure is then an increase from 0 to 1. Write each alert, then test it with one failure on purpose, as later modules do.
Find the slow, expensive step in a trace
Section titled “Find the slow, expensive step in a trace”The table says that v3 is slow and expensive on average. A trace shows where one ticket spends its time and money. Put a good v2 ticket and a failed v3 ticket on the same time scale:
python -m ops waterfall data/telemetry/release-full.jsonl.gz --ticket T-503354Trace 62bdee6f5950708a65de0362c9584db4, ticket T-503354: 14 spans, 9,203 ms from first to lastspan start ms ms cost US$POST /v1/tickets 0 17.4 # (waiting in the queue) 17 165.0 # process ticket job ERROR 182 9,020.4 ################################### triage ERROR 185 9,013.2 ################################### chat chat-small 185 9,008.4 ################################### 0.000650 POST 185 9,006.9 ###################################(9 database queries hidden; --all shows them)Longest step: triage, 9,013 ms (98% of the trace)Costliest step: chat chat-small, US$0.000650 of US$0.000650: 1495 tokens in, 1000 out (1000 of them reasoning), finish length
Text description of the diagram
Both traces start the same way: a short API span and a short wait in the queue. Then the triage call fills almost all of each trace. In the v2 trace, the call takes 2.7 seconds, costs US$0.000308 and ends with stop; the embedding follows. In the v3 trace, the call takes 9.0 seconds, three times as long, and costs US$0.000650, twice as much. It ends with length: all 1,000 output tokens were reasoning. The job and the triage step are marked ERROR, and there is no embedding, because the job stopped at the empty answer.
Now explain the bottleneck from the trace alone. The API and the queue took 0.2 seconds, so they are not the problem. The triage call took 98% of the time and 100% of the cost. Its attributes say why it was long and expensive: the model produced 1,000 output tokens, and every one was reasoning. The provider stopped it at the limit, so it wrote no answer.
You never need to read the hidden reasoning to know this. Its size and its time are in the span: 1,000 tokens and 9 seconds. That points to the cause: prompt v3 makes the model think longer than the token limit allows. The server needs no change: the fix is in the prompt or the limit, which is Priya’s area.
When the provider does not answer
Section titled “When the provider does not answer”The 10 dead letters look different. Ticket T-503258’s trace has five process ticket job spans, one per attempt. In each one, chat chat-small ERROR lasts 10,0xx ms, and ops prints Costliest step: … US$0.000000 … None tokens in:
process ticket job 281 10,030.4 ###### triage ERROR 285 10,019.0 ###### chat chat-small ERROR 285 10,018.4 ######The service waits 10 seconds for the provider (PROVIDER_TIMEOUT), and the recorded answer for this ticket takes 12.1 seconds. So every attempt times out, and the job becomes a dead letter after five attempts. All 10 dead letters are this one practice message, drawn 10 times by the scenario. Its ticket.triaged event says outcome: dead_letter and error.type: ProviderTimeout. That is a provider error, and its fix is a different one: the timeout, Amira’s setting. It stays open until Post-incident learning.
When to use per-version metrics, and what they cost
Section titled “When to use per-version metrics, and what they cost”Count by version whenever two versions can run in the same window: a canary, a rollback, a settings change. Keep the labels few. Each label value multiplies the number of series that Prometheus stores. A version, a release and an outcome are a few dozen series. A ticket ID as a label would be a new series for every ticket, and the store would grow without end. Put per-ticket values in the logs, never in metric labels.
Cost in telemetry is an estimate: tokens times the prices in ticket_api/prices.py. It is right for comparing versions, because both versions use the same prices. It is not the invoice. Kwame checks the provider’s bill each month against the estimate, and he updates the prices when they change.
Common mistakes
Section titled “Common mistakes”Common mistake
Two p95 values for the same calls: 8.34 s in ops, about 10 s in Grafana
Symptom: ops quality says that v3’s triage call has a p95 of 8.34 s. The Grafana panel shows about 10 s for the same replay:
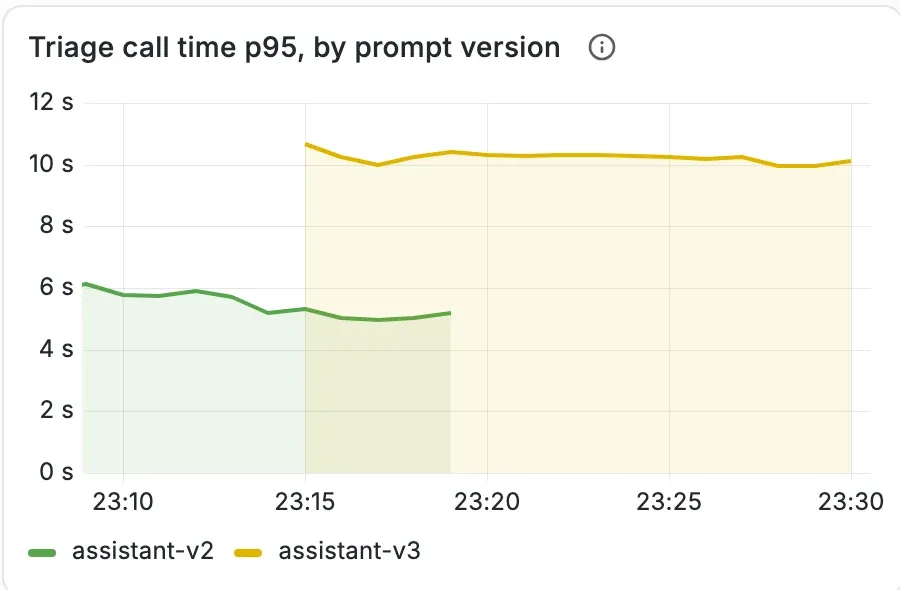
Cause: ops sorts the real durations and takes the 95th percentile. Grafana does not have the durations, only a histogram: counts of calls in buckets, here 5–8 s and 8–12 s. Its histogram_quantile knows that the p95 is in the bucket 8–12 s, and it guesses a value inside that bucket. A wide bucket gives a rough guess.
Fix: compare the two numbers only with care. To decide, use the exact value from the logs (ops). If a limit falls inside a bucket, add a bucket edge at that limit, for example 8 s for the triage-slow alert. The project’s buckets already have an edge at 8 s.
Common mistake
The dead letters look free
Symptom: ops quality --by evidence shows a column None with 10 dead letters and a cost of 0.000.
Cause: the service records a cost only when an answer arrives with its token counts. A timed-out call returns no counts. The provider may still have worked on the request, and some providers bill for that work.
Fix: never read a cost of 0 as “free”. Count the failed calls (error.type), and ask the provider how it bills a request that the client stopped waiting for. Kwame owns that question.
Knowledge check
Section titled “Knowledge check”Check your understanding
Omar says: 'Prompt v3 sends fewer tokens, so it is cheaper.' Use last week's ops quality table to answer him.
Show the answer
v3 sends fewer input tokens (median 1,477 against 1,902), but it writes more output tokens (627 against 260). At the assumed prices, output tokens cost five times as much. Per median call: 425 fewer input tokens save US$0.0000425, and 367 more output tokens cost US$0.0001835. Per 1,000 tickets, v3 costs US$0.474 against US$0.338, 40% more. Its failed tickets add to that: an answer without text costs the full 1,000 output tokens.
Does your answer have the main points of ours?
Sign in and enroll in the course to save your answers. Every check counts toward the certificate.
Check your understanding
Two tickets failed last week: T-503354 (no_answer) and T-503258 (dead_letter). Why does the outcome category matter for who acts?
Show the answer
no_answer means that the model used all its tokens on reasoning. The cause is the prompt or the token limit, so Priya looks first. dead_letter means that the provider gave no answer within the timeout, on every attempt. The cause is the timeout setting or the provider, so Amira looks first, then Kwame. One count of “failed tickets” would send both problems to the same person.
Does your answer have the main points of ours?
Sign in and enroll in the course to save your answers. Every check counts toward the certificate.
Check your understanding
Practical check: with ops waterfall, find the slowest step and the costliest step of ticket T-503354, and say why it was slow without reading the model's reasoning.
Show the answer
python -m ops waterfall data/telemetry/release-full.jsonl.gz --ticket T-503354 prints Longest step: triage, 9,013 ms (98% of the trace) and Costliest step: chat chat-small, US$0.000650 … 1000 out (1000 of them reasoning), finish length. The API and the queue took about 0.2 s. The call was slow because the model spent all 1,000 output tokens on hidden reasoning and the limit stopped it. The span shows the size and the time of the reasoning, not its text, and that is enough to point at the prompt and the limit.
Does your answer have the main points of ours?
Sign in and enroll in the course to save your answers. Every check counts toward the certificate.
Recap
- Label every outcome, token count and cost with the prompt version and the release, so any number splits by version.
- A task outcome names what happened to each ticket. The failure categories (
no_answer,dead_letter, …) point to different causes and owners. - Cost attribution puts each call’s estimated cost on its span, its ticket and its version. Failed tickets cost money too.
- Last week, v3 cost 40% more and failed one ticket in ten. One trace showed why: a 9-second call that spent all its tokens on reasoning.
Next, you look at what else the telemetry holds: could it leak a customer’s message? You measure what each privacy setting costs.