
Data and concept drift
- Lesson 11
- 55 min
- Module 4: Monitor changing behaviour
Lesson 11 of 19 · MLOps and LLMOps: Operating AI in ProductionData and concept drift
1. Define operational ownership
2. Version and reproduce the system
3. Instrument useful telemetry
4. Monitor changing behaviour
5. Release and improve safely
6. Handle incidents and handoff
What you will be able to do
Find out when the tickets that reach the assistant change, and say how much they changed with a stated method. Then keep “the inputs changed” apart from “the assistant is now wrong”. Only the second one hurts customers, and drift alone cannot show it.
Before you startWhat to know and to have ready
What you need to know
- The telemetry of the service and
python -m ops summary, from Logs, metrics and traces, and quality by prompt version, from Quality and costs. - The quality SLO (90% of reviewed tickets agree with the agent), from Service objectives.
- The practice tickets and Grace’s labels, from Run the live service. Drift as a production signal, from Production feedback.
What you need on your computer
- Your project
ticket-apiat the end of Module 3, or a copy of the snapshotend-of-m03.python -m pytestprints200 passed. - Docker running PostgreSQL and Valkey (
docker compose up -d db cache), for the migration and the tests. - The saved telemetry in
data/telemetry/, copied from the labs repository in Artifact lineage.
No account, no key and no money. The steps that read saved files need no Docker.
The post office sorter
Section titled “The post office sorter”Think of a person who sorts letters at a post office. They read the postcode on each envelope and put the letter in the bag for its district. They have done it for years, and they are good at it.
Three different things can change in their week:
- More letters come from abroad. The envelopes look different, and the handwriting is new. The rule is the same: postcode 4 goes to bag 4. The sorter may still be right on every letter.
- The city moves a street to another district. The envelopes look exactly as before. But the right bag for that postcode is now another one, and the sorter’s old rule is wrong.
- Letters go to the wrong district. Nobody sees it at the sorting table. The sorter learns it days later, when the districts send back the letters that they should not have received.
Only the third one is a measured mistake, and the post office learns about it late. The help desk’s assistant has the same three kinds of change.
The problem: an alarm that points the wrong way
Section titled “The problem: an alarm that points the wrong way”In this lesson you read a practice run that we made on purpose: the drift scenario. The service received 3,000 practice tickets in three blocks of 1,000. Agents reviewed half of the tickets, 120 seconds after each one arrived. The answers are real recordings from the evaluation course; the mix of tickets is constructed:
- Normal: tickets as usual.
- French: a new region starts to write, and French tickets become six times more likely.
- Policy-silent: a new payment option starts, and questions that the shop’s policy does not answer become six times more likely.
Priya watched one number: the share of French messages. In the second block, it went from 5% to 25%, and her check said LARGE change. Tomás said at once: “Drift alert fired: retrain automatically.”
Then the agents’ reviews arrived. In the French block, the assistant agreed with the agents on 95.8% of the reviewed tickets: as good as before. In the third block, Priya’s language check said no real change. But agreement fell to 85.3%, below the 90% quality SLO.
Her one alarm fired for the harmless change and stayed quiet for the harmful one.
The idea: four things that can change
Section titled “The idea: four things that can change”Use four names, and keep them apart:
- Data drift, also called input drift: the inputs change. More French tickets, longer messages, a new product. The sorter’s letters from abroad.
- Prediction drift: the assistant’s decisions change. It sends more tickets to
returns, or fewer to a person. You can see it at once, because the decisions are in the telemetry. - Concept drift: the right answer for the same input changes. The shop makes a new rule, for example “every battery ticket now needs a person”. The tickets look the same, but the old decisions are now wrong. This is the street that moved to another district.
- Performance decay: the measured quality falls. The decisions and the agents’ reviews agree less often. This is the only one of the four that says “the assistant is now wrong”. It needs the true answers, the labels.
“Drift” means a slow or sudden move away from a reference. The reference is a period that you trust, for example the first 1,000 tickets, when the reviews said that the assistant worked.

Text description of the diagram
The ticket goes into the assistant, and the assistant gives a decision. Hours or days later, an agent’s review says what the right decision was. Data drift is a change in the tickets. Prediction drift is a change in the decisions. Concept drift changes the right answer, so you see it only through the reviews. Performance decay is the measured result: decisions and reviews agree less often.
Data drift and prediction drift are fast: the telemetry has them seconds after each ticket. Concept drift and performance decay need labels, so they are slow.
A tiny example: how much, and how sure
Section titled “A tiny example: how much, and how sure”To call something “drift”, you need a method and a threshold that you write down. Two questions need two numbers:
- How much did it move? The project uses the population stability index (PSI). For each category, it takes the change of the share and weights it by how many times larger or smaller the share became. Then it adds the parts. So a share that goes from 5% to 25% counts much more than one that goes from 75% to 95%.
- How sure are we that it moved? A chi-square test asks: if nothing changed, how often would two samples differ this much by chance? That chance is the p-value. The project calls p < 0.01 “different”.
Take 100 reference tickets, 95 in English and 5 in French, and 100 current tickets, 75 in English and 25 in French. For each language, the PSI part is (current share − reference share) × ln(current share ÷ reference share):
- English: (0.75 − 0.95) × ln(0.75 ÷ 0.95) = (−0.20) × (−0.236) = 0.047
- French: (0.25 − 0.05) × ln(0.25 ÷ 0.05) = 0.20 × 1.609 = 0.322
The PSI is 0.047 + 0.322 = 0.369. Run it, then change the counts:
Run Python in your browser
PSI and a chi-square test on 100 tickets
The box prints each part, the PSI 0.369, and the chi-square test: statistic 15.7, p-value 7.5e-05. Multiply every count by 10 and run it again. Then try a small change, 7% → 14% French, with 100 and with 1,000 tickets.
Tab adds four spaces. Press Esc, then Tab, to leave the box. Ctrl+Enter runs the code.
The four runs, side by side:
| Reference → current | Tickets in each | PSI | p-value |
|---|---|---|---|
| 5% → 25% French | 100 | 0.369 | 7.5e-05 |
| 5% → 25% French | 1,000 | 0.369 | 5.5e-36 |
| 7% → 14% French | 100 | 0.054 | 0.11 |
| 7% → 14% French | 1,000 | 0.054 | 3.3e-07 |
Read the table slowly. The PSI depends only on the shares, so ten times more tickets give the same PSI. The p-value depends on the count. With 1,000 tickets, the small change gets a tiny p-value: it is real, but it is small. So read the two together: PSI for how much, p-value for how sure.
For the PSI, people use a rule of thumb: below 0.1, no real change; 0.1 to 0.2, a small change; above 0.2, a large change. It is a convention from credit scoring, not a law of nature. The project writes it in ops/stats.py, so that everyone uses the same one. For a number such as message length, the project cuts the reference into 10 bins with the same count each (deciles). Then it counts the current tickets in the same bins.
Add the module’s files to your project
Section titled “Add the module’s files to your project”This module adds files for all three of its lessons: the drift and label tools, the agents’ reviews and a retrieval index for the answers. Copy them now, once. Each lesson explains its own files.
-
In a terminal, go to your project and activate the virtual environment.
Terminal window cd ~/projects/ticket-apisource .venv/bin/activateTerminal window cd ~\projects\ticket-api.venv\Scripts\Activate.ps1 -
Copy the module’s files from the snapshot
end-of-m04. Eleven files are new, and seven change.Terminal window S=../nextia-learning-labs/C25/snapshots/end-of-m04for f in migrations/018_ticket_reviews.sql migrations/019_answer_index.sql \ticket_api/reviews.py ticket_api/answers.py ticket_api/main.py ticket_api/repository.py \ticket_api/worker.py ops/stats.py ops/cmd_drift.py ops/cmd_labels.py ops/cmd_rag.py \scripts/reindex.py scripts/send_reviews.py scripts/update_document.py scripts/load.py \tests/test_monitoring.py contract/openapi.json README.md; docp "$S/$f" "$f"doneTerminal window $S = "..\nextia-learning-labs\C25\snapshots\end-of-m04"$files = 'migrations\018_ticket_reviews.sql', 'migrations\019_answer_index.sql','ticket_api\reviews.py', 'ticket_api\answers.py', 'ticket_api\main.py', 'ticket_api\repository.py','ticket_api\worker.py', 'ops\stats.py', 'ops\cmd_drift.py', 'ops\cmd_labels.py', 'ops\cmd_rag.py','scripts\reindex.py', 'scripts\send_reviews.py', 'scripts\update_document.py', 'scripts\load.py','tests\test_monitoring.py', 'contract\openapi.json', 'README.md'foreach ($f in $files) { Copy-Item "$S\$f" $f } -
Apply the two new migrations. They add two tables and keep your data.
Terminal window python -m ticket_api.migrateapplied 018_ticket_reviewsapplied 019_answer_indexDatabase is up to date (19 migrations). -
If your
.envhas aRELEASE_IDline with an ID, update the release. Its manifest names the old last migration, so the service and the tests would refuse to start. Build a new manifest for prompt v2, as in Artifact lineage:Terminal window python -m ops release build --prompt assistant-v2 --evidence baseline-v2-chat-small-r1-b6a2b9 --writeThe last line:
Saved operations/releases/1.5.0-c7b614.toml. Run the service with RELEASE_ID=1.5.0-c7b614Set
RELEASE_IDin.envto the ID that your command printed. Your ID differs if your project is a Git repository or a file differs. IfRELEASE_ID=is empty, skip this step. -
Run the tests. Expect
207 passed, 7 more than before:Terminal window python -m pytest207 passed, 1 deselected in 24.87s
| Files | What they add | Lesson |
|---|---|---|
ops/stats.py, ops/cmd_drift.py |
PSI, chi-square and Wilson with the standard library; python -m ops drift |
this one |
migrations/018_ticket_reviews.sql, ticket_api/reviews.py, main.py, repository.py, scripts/send_reviews.py, ops/cmd_labels.py |
the agents’ reviews, POST /v1/tickets/{id}/review, python -m ops labels |
Delayed labels |
migrations/019_answer_index.sql, scripts/reindex.py, scripts/update_document.py, ticket_api/answers.py, scripts/load.py, ops/cmd_rag.py |
the answers’ retrieval index and python -m ops rag |
LLM/RAG regressions |
tests/test_monitoring.py, contract/openapi.json, README.md, ticket_api/worker.py |
tests, the API contract, the commands; layout only in worker.py |
all three |
Read the drift run
Section titled “Read the drift run”The saved file data/telemetry/drift.jsonl.gz holds the drift scenario. Each ticket.received event has a language guess, made from common words; the text itself is never saved. The event also has the message length in characters and the channel. Each ticket.triaged event has the decision.
Compare each block of 1,000 tickets with the first one:
python -m ops drift data/telemetry/drift.jsonl.gz --windows 1000Each window of 1000 tickets against the first window:tickets French (guess) PSI language p PSI team--------- -------------- ------------ ----- --------1-1000 5.4% 0.000 1 0.0001001-2000 24.9% 0.343 5e-34 0.0162001-3000 3.4% 0.010 0.029 0.047The first row is the reference, so it is 0.000 against itself. The French block has a language PSI of 0.343: above 0.2, a large change. Its p ≈ 5e-34, so it is not chance. The policy-silent block has a PSI of 0.010 and p = 0.029: no real change, and not “sure” by the p < 0.01 rule.
The last column is prediction drift. The team that the assistant chose hardly moved: 0.016 and 0.047, both below 0.1.
The course’s full report of each block, made by the same function, adds the message length. It moved a little in both blocks: PSI 0.196 in the French block (median 225 → 178 characters) and 0.119 in the policy-silent block. In the policy-silent block, nothing crosses 0.2.
Smaller windows show when the change starts and ends:
python -m ops drift data/telemetry/drift.jsonl.gz --windows 500Each window of 500 tickets against the first window:tickets French (guess) PSI language p PSI team--------- -------------- ------------ ------- --------1-500 4.8% 0.000 1 0.000501-1000 6.0% 0.003 0.4 0.0131001-1500 24.4% 0.364 1.7e-18 0.0181501-2000 25.4% 0.393 9.3e-20 0.0182001-2500 2.8% 0.011 0.098 0.0192501-3000 4.0% 0.002 0.54 0.065The French share jumps from about 5% to about 25%, and then it comes back.
A tiny p-value on a small change
Section titled “A tiny p-value on a small change”--at splits the run at a minute instead. Split it in the middle of the French block, at minute 9.2:
python -m ops drift data/telemetry/drift.jsonl.gz --at 9.2Reference: before minute 9.2 (1,105 tickets). Current: from minute 9.2 (1,895 tickets).kind feature PSI p-value verdict reference -> current------ -------------- ----- -------- -------------- ------------------------------------------------------------input language_guess 0.049 3.22e-08 no real change en 93% -> 86%, fr 7% -> 14%input message_chars 0.098 1.71e-10 no real change median 223 -> 187 charactersinput channel 0.000 1 no real change web_form 100% -> 100%output team 0.023 0.00299 no real change delivery 28% -> 25%, warranty 21% -> 20%, returns 17% -> 21%output needs_human 0.000 0.728 no real change False 75% -> 76%, True 25% -> 24%output outcome 0.001 0.435 no real change ok 100% -> 100%, no_answer 0% -> 0%PSI: < 0.1 no real change, 0.1-0.2 small, > 0.2 large (a rule of thumb). p-value: chi-square test; < 0.01 = the difference is unlikely to be chance.Drift is not an error rate: compare the agents' reviews (python -m ops labels).This is the tiny example again, with real tickets. The current period mixes French tickets with policy-silent ones, so French goes only from 7% to 14%. The PSI is 0.049, below 0.1, but the p-value is 3.22e-08, because there are almost 3,000 tickets. An alarm on the p-value alone would fire on this small change. And the last line says it: drift is not an error rate.
Drift and accuracy point different ways
Section titled “Drift and accuracy point different ways”Now add the agents’ reviews. The next lesson explains ops labels; here, read only the “agrees” column:
python -m ops labels data/telemetry/drift.jsonl.gz --windows 10003,000 tickets, 1,445 reviewed (48%); review delay median 120 s, p95 121 swindow tickets reviewed agrees (95% interval) no answer to a person French----------- ------- -------- --------------------- --------- ----------- ------ 1-1000 1000 474 95.1% [92.8%, 96.7%] 0.1% 25.1% 5.4% 1001-2000 1000 495 95.8% [93.6%, 97.2%] 0.1% 24.0% 24.9% 2001-3000 1000 476 85.3% [81.8%, 88.2%] 0.3% 24.8% 3.4%Reviews arrive later: the last windows have fewer. For a margin of about 5 points on an agreement near 90%, a window needs 139 reviews.Put the two tables next to each other:
| Block | Language PSI | Agreement with the reviews |
|---|---|---|
| Normal | 0.000 (the reference) | 95.1% |
| French | 0.343, large | 95.8%, unchanged |
| Policy-silent | 0.010, none | 85.3%, below the SLO |
The chart puts both signals on one clock. Each point is a block of 250 tickets. The French share is drawn when the block’s last ticket arrived. The agreement is drawn when the block’s last review arrived, about 2 practice minutes later.
- French messages, known at once
- Agreement with the reviews, known later
- Quality SLO (90%)
Text description of the chart
The x axis shows the 28 practice minutes of the drift run. The first line, the share of French messages, is about 4% to 7% until minute 8. It rises to 23% to 28% from minute 10 to 17, then falls back to 3% to 5%. The second line, the agreement with the agents’ reviews, starts at minute 4. It stays between 94% and 98% while French rises and falls, above the dashed 90% line. From minute 20.7, it falls to between 81% and 87%, below the line, and it stays there to the end.
Why did the policy-silent block fail without drift? Those tickets ask questions that the shop’s policy does not answer, so the right team is hard to choose. In the practice set, they were always the assistant’s weak slice. Their language and length look normal, and the team mix hardly changes. So none of the features that Priya watched could see them.
This is not concept drift. The right answer for each of those tickets did not change. The mix moved toward tickets that the assistant was always weak at, on a feature that nobody measured. You can watch more features. But you can never list every way in which tickets differ, and that is why labels exist.
The quick decision signals did not help either. The share sent to a person stayed near 25% in all three blocks:
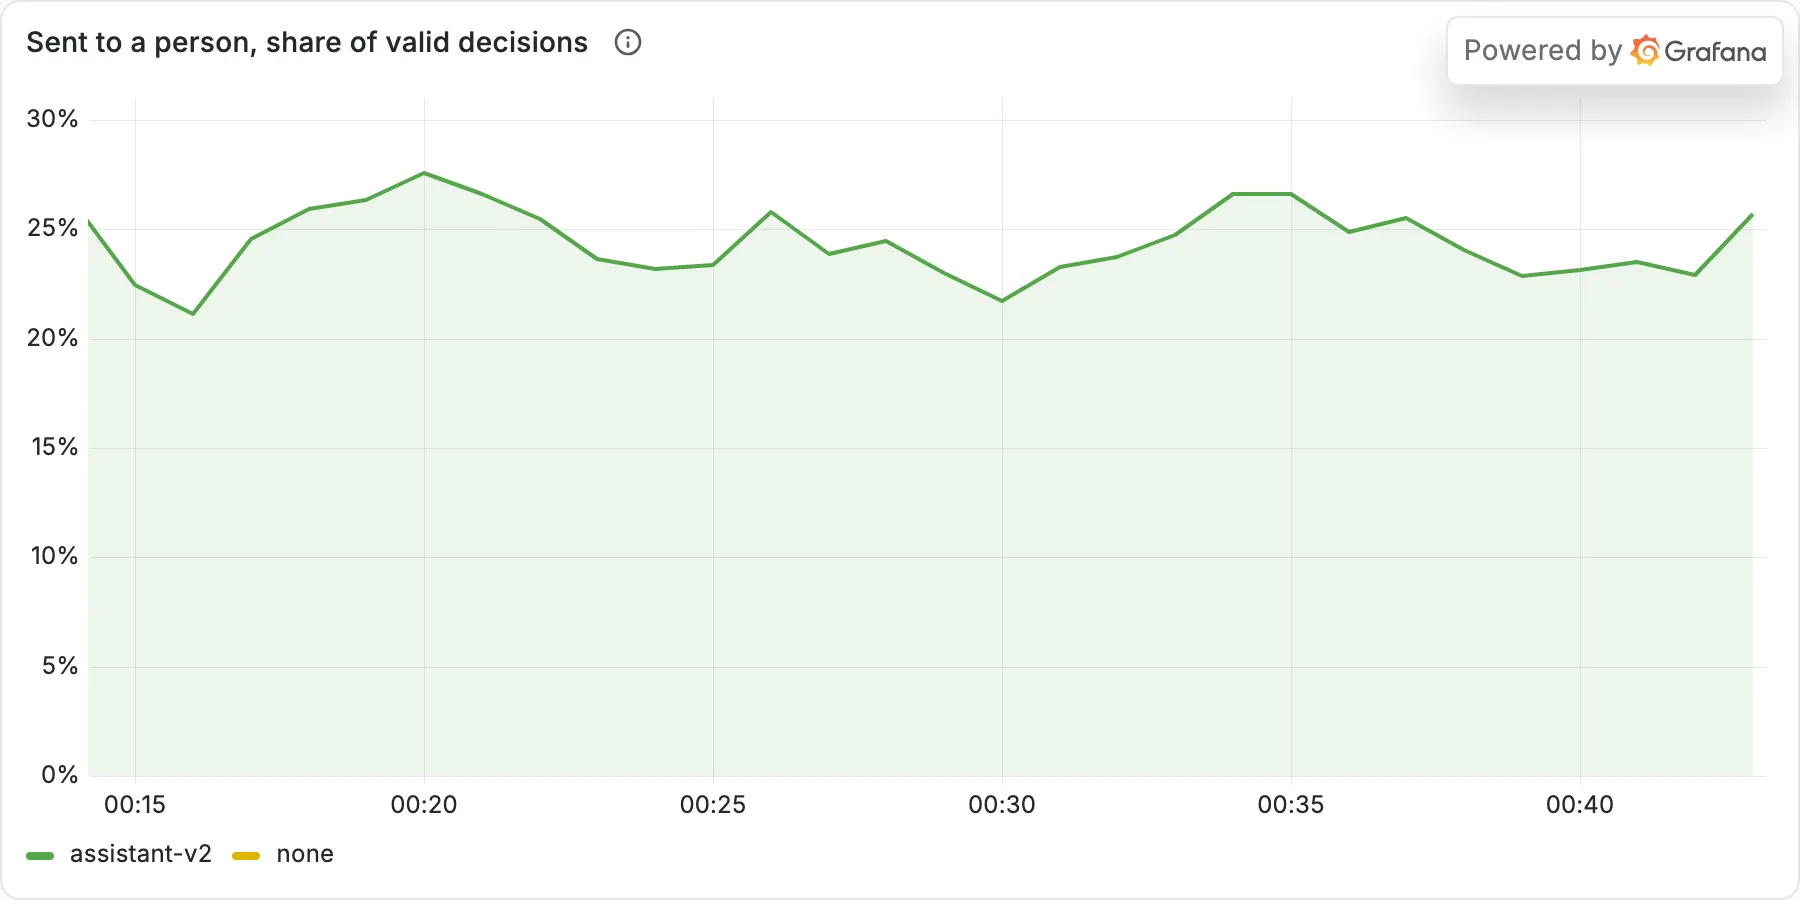
You cannot tell from this line where either block starts.
What concept drift would look like
Section titled “What concept drift would look like”The drift run has no concept drift, so here is a constructed example. Suppose that Larkfield decides that every ticket about a battery now needs a person, because of a new safety rule. The battery tickets look exactly as before: the same words, length and language. The assistant still marks most of them “no person needed”.
Data drift and prediction drift checks show nothing, because neither the inputs nor the decisions changed. Only the reviews show it: the agents now mark those tickets “needs a person”, and agreement falls. The fix is a new policy and prompt, chosen from the cause, as Retrain or revise in Module 5 shows.
“Drift alert fired: retrain automatically”
Section titled ““Drift alert fired: retrain automatically””Tomás’s idea sounds safe. It is not, for three reasons:
- Drift is not a mistake. The French block shows it: a large change, and no loss.
- There is nothing to retrain. The assistant is a prompt and a hosted model. A new prompt is a release, and it needs the evaluation gate of Module 5.
- The cause decides the fix. Policy-silent tickets need an answer in the policy; a new rule needs a new prompt. An automatic retrain chooses neither.
Amira writes the team’s rule: a drift alert opens an investigation, never a change. Priya looks at the slice that moved and asks for reviews of those tickets first. Then she decides from the reviews.
When to watch drift, and what it costs
Section titled “When to watch drift, and what it costs”Sam asks, “If drift does not prove anything, why watch it?”
Priya answers: “Because it is fast. Reviews take days. Drift tells me on the same day which tickets to check first.”
Watch drift on a few inputs that you can explain: language, length, channel, product. Watch the decisions too: team and needs a person. Write the reference period, the method and the threshold in a file, so that everyone reads the same number.
Do not page a person on drift alone, and do not trigger a change from it. Do not test many features with p < 0.01 and treat every hit as news: with large samples, almost everything is “different”.
What it costs: a few lines of statistics, and one telemetry attribute for each input that you watch. The real cost is attention: each drift alert needs a person to look. So keep the list short.
Common mistakes
Section titled “Common mistakes”Common mistake
ops drift stops: fewer than two windows
Symptom: python -m ops drift data/telemetry/drift.jsonl.gz --windows 5000 prints one line and exits with code 2:
ops drift: fewer than two windows of 5000 ticketsCause: the file has 3,000 tickets. The tool needs a reference window and at least one more full window.
Fix: use a window of at most half the tickets, for example --windows 1000. A window must also be large enough for its shares: with 50 tickets, one French ticket moves the share by 2 points.
Common mistake
ops drift with one file and no split
Symptom: python -m ops drift data/telemetry/drift.jsonl.gz exits with code 2:
ops drift: give two files, or one file with --at or --windowsCause: drift is always “this period against that period”. With one file, the tool does not know which period is the reference.
Fix: add --windows N or --at MINUTE, or give two files: the reference first, then the current one.
Reset. If your project is broken, copy the snapshot end-of-m04, keep your .env, and run python -m scripts.load --reset. Then do step 4 of Add the module’s files again. The snapshots README explains the reset.
Knowledge check
Section titled “Knowledge check”Check your understanding
Name the four kinds of change in this lesson. For each one, say if the service's own telemetry can show it on the same day, and why.
Show the answer
Data drift (the tickets change) and prediction drift (the decisions change): yes, both are in the telemetry seconds after each ticket. Concept drift (the right answer for the same ticket changes) and performance decay (decisions and reviews agree less): no. Both need the true answers, the agents’ reviews, which arrive later. Concept drift may show no data drift and no prediction drift at all.
Does your answer have the main points of ours?
Sign in and enroll in the course to save your answers. Every check counts toward the certificate.
Check your understanding
Predict: the share of Larkfield's tickets about returns goes from 20% to 22%. With 100 tickets in each period, and then with 10,000, what happens to the PSI and to the p-value?
Show the answer
The PSI is the same in both cases, because it depends only on the shares. It is (0.22 − 0.20) × ln(0.22 ÷ 0.20) + (0.78 − 0.80) × ln(0.78 ÷ 0.80) ≈ 0.0019 + 0.0005 ≈ 0.0024, far below 0.1. The p-value gets much smaller with 10,000 tickets. With 100, a 2-point difference is easily chance. With 10,000, it is real but tiny. Report “no real change”, with the PSI.
Does your answer have the main points of ours?
Sign in and enroll in the course to save your answers. Every check counts toward the certificate.
Check your understanding
Practical check: with the saved drift run, show that the language changed a lot in one block while the assistant's quality did not, and that quality fell in another block without input drift. Which commands and lines do you use?
Show the answer
python -m ops drift data/telemetry/drift.jsonl.gz --windows 1000: tickets 1001–2000 have a language PSI of 0.343 (large, p ≈ 5e-34); tickets 2001–3000 have 0.010. python -m ops labels data/telemetry/drift.jsonl.gz --windows 1000: agreement 95.8% in the French block, and 85.3% [81.8%, 88.2%] in the third block. Your project must also print 207 passed.
Does your answer have the main points of ours?
Sign in and enroll in the course to save your answers. Every check counts toward the certificate.
Recap
- Data drift is a change in the inputs, and prediction drift a change in the decisions. Concept drift is a change in the right answer for the same input. Performance decay is a measured fall in quality: the only one that measures mistakes, and it needs labels.
- PSI says how much a distribution moved (rule of thumb: < 0.1 none, 0.1–0.2 small, > 0.2 large, a convention). The chi-square p-value says how sure you are. With many tickets, tiny changes get tiny p-values, so read both.
- In the drift run, French tickets made a large change (PSI 0.343) with no loss of quality (95.8%). Policy-silent tickets made no real change on language (0.010), and quality fell to 85.3%.
- A drift alert opens an investigation. It never triggers a retrain or a release.
- Your project has the module’s files, and
python -m pytestprints207 passed.
Next, you look at the labels themselves: the agents’ reviews. They arrive late. What do you watch until then, and how many tickets must people check?
Next: Delayed labels