
Logs, metrics and traces
- Lesson 8
- 60 min
- Module 3: Instrument useful telemetry
Lesson 8 of 19 · MLOps and LLMOps: Operating AI in ProductionLogs, metrics and traces
1. Define operational ownership
2. Version and reproduce the system
3. Instrument useful telemetry
4. Monitor changing behaviour
5. Release and improve safely
6. Handle incidents and handoff
What you will be able to do
Last week, the service wrote log lines that nobody could join together. Make the API, the worker and the provider client describe each ticket so that you can follow it from end to end. Give it one trace, and logs and metrics that share its IDs.
Before you startWhat to know and to have ready
What you need to know
- Run the live service: the triage step, the practice tickets and
python -m ops. - Artifact lineage: the release ID that every answer carries.
- The job queue from Job lifecycle, and the timer in the
Server-Timingheader from Find the bottleneck.
What you need on your computer
- Your project at the snapshot
end-of-m02, with Docker Desktop for PostgreSQL, Azurite and Valkey. - Optional: about 900 MB of disk space and 1.3 GB of free memory for the Grafana container.
Without Docker, you cannot run the service. Skip to Read a saved trace. It needs only Python and the saved telemetry in data/telemetry/.
A parcel and its tracking number
Section titled “A parcel and its tracking number”Think of a parcel that you send across the country. The delivery company keeps three kinds of records about it.
Each depot scans the parcel when it arrives and when it leaves. Online, you see these scans in order, with a time for each one, so you can see where the parcel waited for two days. The drivers write short notes: “Nobody at home, left a card.” And the company counts things for all parcels together: parcels per day, parcels late, parcels lost.
One number joins the three records: the tracking number. With it, you can go from “more parcels are late” to one late parcel. From that parcel, you go to the note that explains it.
The ticket service needs the same three records and the same kind of number.
The problem: two log lines that never meet
Section titled “The problem: two log lines that never meet”After last week, Grace asked Amira a simple question: “The frying pan ticket, T-65663. What happened to it?” Amira opened the console logs. At the snapshot end-of-m02, the API writes one line per request, and the worker writes one line per job. Here are the two formats, with values from the course’s own run:
INFO ticket_api: POST /v1/tickets 202 7ms queries=5 id=c0274d01c5232026-10-11 04:16:32,552 INFO ticket_api.worker: job 3: succeeded (attempt 1)These two lines are about the same ticket, but nothing says so. The API’s line has a request ID, and no ticket. The worker’s line has a job number, and no request ID, no ticket, no prompt version and no reason for a failure. So Amira could not join them. She could not answer Grace, and she could not count how many tickets failed with prompt v3.
Each process told its own story, and the stories never met. The queue makes it harder: between the API and the worker, the ticket waits in a database table, where no process holds it.
The idea: three signals with shared IDs
Section titled “The idea: three signals with shared IDs”The service must write three kinds of records, as the delivery company does. Together they are the service’s telemetry, and each kind is a signal:
- A log is a record of one event, with its time and details. Here, logs are events with fixed names:
ticket.receivedwhen the API accepts a ticket,ticket.triagedwhen the worker finishes it. Fixed names let a program count them, as the depots’ scans are counted. - A metric is a number that the service adds up over time, for every ticket. Examples: tickets triaged by outcome and prompt version, tokens per call, cost. Metrics are small and cheap, so they never skip a ticket.
- A trace is the path of one request through the system. It is made of spans: one span per step, with a start, an end and attributes (named values, such as the prompt version). A span can have child spans, so a trace is a tree of steps.
The tracking number is two IDs. The trace ID names one ticket’s trace, and each log event that happens inside a span carries it. The request ID is the API’s own ID for the request, and the worker’s console lines now carry it too.
The service makes these records with OpenTelemetry, an open standard and a set of libraries for telemetry. The code says what to record; an exporter says where it goes. This project has two exporters. One writes a file of JSON lines that python -m ops reads. The other, if you want it, sends to an OpenTelemetry Collector, a program that receives telemetry and passes it on, here to Grafana.

Text description of the diagram
Read the diagram from the ticket outward. Each signal answers its own question. A log event says what happened to this ticket. The trace says where its time and cost went. A metric says how often something happens across all tickets. The shared IDs let you move between them. You go from a metric that rises, to the log events of the failed tickets, to the trace of one of them. Everything is saved to files; Grafana is optional.
A tiny example: one ticket, every record
Section titled “A tiny example: one ticket, every record”Here is one ticket from the author’s run of this lesson: T-500001, a practice ticket about a damaged fire pit. Its records are pasted from the telemetry files and shortened for space.
The API wrote one event when it accepted the ticket:
{"signal": "log", "service": "ticket-api", "event": "ticket.received", "trace_id": "d2bdff5b10aa9b2c70503f7581b2054b", "attributes": {"request.id": "7e9a07239ab6", "ticket.id": "T-500001", "job.id": 1, "http.status_code": 202, "ticket.channel": "web_form", "ticket.message_chars": 216, "ticket.language_guess": "en", "ticket.message_sha256": "1fcdc0c6d3790e4e", "customer.ref": "09a4de5cda"}}The worker wrote one event when it finished the job, 2.8 seconds later:
{"signal": "log", "service": "ticket-worker", "event": "ticket.triaged", "trace_id": "d2bdff5b10aa9b2c70503f7581b2054b", "attributes": {"request.id": "7e9a07239ab6", "ticket.id": "T-500001", "job.attempt": 1, "release.id": "none", "prompt.version": "assistant-v2", "outcome": "ok", "time_to_draft_s": 2.842, "cost_usd": 0.0002933, "triage_ms": 2450.8, "gen_ai.response.model": "gpt-6-luna-2026-09-22", "gen_ai.response.finish_reasons": "stop", "gen_ai.usage.input_tokens": 1903, "gen_ai.usage.output_tokens": 203, "gen_ai.usage.reasoning_output_tokens": 101, "evidence": "replayed", "team": "delivery", "needs_human": false, "language": "en"}}Look at three things. First, the two events come from two processes, and they have the same trace ID and request ID. Second, the ticket’s text is not there: only its length, a guess of its language and a short hash. A hash is a fingerprint of the text: the same text gives the same hash, but you cannot read the text back. Privacy-aware observability explains why. Third, release.id is none: the author’s run had no release manifest. With RELEASE_ID set, as in Artifact lineage, your release ID goes here, for example 1.5.0-3ad293.
The worker also sent a metric. Every 15 seconds, it writes the counter of finished tickets, one value for each combination of labels (shortened):
{"signal": "metric", "name": "app.tickets.triaged", "points": [ {"attributes": {"outcome": "ok", "prompt.version": "assistant-v2", "needs_human": "true"}, "value": 3}, {"attributes": {"outcome": "ok", "prompt.version": "assistant-v2", "needs_human": "false"}, "value": 2}, {"attributes": {"outcome": "no_answer", "prompt.version": "assistant-v2", "needs_human": "none"}, "value": 0}]}Five tickets: 3 sent to a person, 2 not, 0 without an answer. The metric does not say which tickets; the logs do. The trace of T-500001 has 22 spans, and you read it later in this lesson.
One trace across the queue
Section titled “One trace across the queue”A trace is easy inside one process. The library keeps the current span in memory, and every new span becomes its child. But the ticket leaves the API and waits in the jobs table. Later, another process takes it.
So the API writes the trace’s context into the job. A standard format, the W3C traceparent, holds the trace ID and the current span’s ID in one short text. Migration 017_job_trace_context.sql adds two columns to jobs: trace_context and request_id. In ticket_api/intake.py, the API saves both with the new job:
job = jobs.enqueue( conn, ticket["ticket_id"], actor, # … the scaling course's arguments … request_id=telemetry.REQUEST_ID.get(), trace_context=telemetry.traceparent(),)In ticket_api/worker.py, the worker starts the job’s span with that context as its parent:
with telemetry.tracer.start_as_current_span( "process ticket job", context=telemetry.context_from(job.get("trace_context")), kind=SpanKind.CONSUMER, attributes=attributes,) as span:
Text description of the diagram
The API’s span starts when the request arrives. Before the API answers 202, it saves the trace context and the request ID in the job’s row. For 157 milliseconds, no process holds the ticket: only the row has the IDs. The worker takes the job, reads the context, and starts its span as a child of the API’s span. So the AI call and the final event belong to the same trace as the request.
The worker’s poll of the queue is not a ticket’s work, so the code switches tracing off around it (telemetry.quiet()). Before that change, the course team counted 208 UPDATE spans for 20 tickets: the polling buried the useful spans.
A span for each AI call
Section titled “A span for each AI call”The provider client, ticket_api/provider.py, wraps each call in a span named after the operation and the model: chat chat-small or embeddings embed-small. Its attributes follow OpenTelemetry’s GenAI semantic conventions, agreed names for AI calls: gen_ai.request.model, gen_ai.response.model, gen_ai.usage.input_tokens, gen_ai.usage.output_tokens, gen_ai.response.finish_reasons. These conventions still have the status “development”, so a name can change in a later version. The service keeps them in one file, so a change touches one place.
The span also has app.cost_usd, the service’s own estimate. Take T-500001’s triage call. It had 1,903 tokens in at US$0.10 per million, and 203 tokens out at US$0.50 per million: US$0.0002918. These are the course’s assumed prices in ticket_api/prices.py. Prices change: check the provider’s current page before you use them for a real budget.
Add telemetry to your project
Section titled “Add telemetry to your project”The snapshot end-of-m03 has the code above and the files of this module’s next two lessons. You copy it once.
-
Stop the API, the worker and the simulator if they run. Copy the snapshot over your project. It has no
.envorsecrets/, so yours stay.Terminal window cp -R ../nextia-learning-labs/C25/snapshots/end-of-m03/. .Terminal window Copy-Item -Recurse -Force ..\nextia-learning-labs\C25\snapshots\end-of-m03\* . -
Install the new packages: OpenTelemetry’s API, its SDK, the exporter, and the instrumentations for FastAPI, psycopg and httpx.
Terminal window python -m pip install -r requirements.txtpython -m pip listthen showsopentelemetry-sdk 1.45.1andopentelemetry-instrumentation-fastapi 0.66b1. Theb1means that the instrumentations are still in beta. -
If your
.envhas aRELEASE_IDline with an ID, update the release first. Your manifest from Artifact lineage ends with migration 016, and this module adds migration 017. So the service, the tests andscripts.loadwould refuse it. Build a new manifest for prompt v2:Terminal window python -m ops release build --prompt assistant-v2 --evidence baseline-v2-chat-small-r1-b6a2b9 --writeThe last line:
Saved operations/releases/1.5.0-3ad293.toml. Run the service with RELEASE_ID=1.5.0-3ad293Set
RELEASE_IDin.envto the ID that your command printed. The code changed, so the code fingerprint and the ID changed too. IfRELEASE_ID=is empty, skip this part. -
Apply the new migration and load the data again:
Terminal window python -m scripts.load --resetapplied 017_job_trace_contextDatabase is up to date (17 migrations).Loaded the small data in 0.6 s: -
Run the tests:
python -m pytest. Expect200 passed, 1 deselected, 7 more than before. The new tests check one trace per ticket, the redaction and the sampling. -
Open
.env.example. Copy the block that starts with# Telemetry (Module 3)to the end of your.env. Its first setting is the one that matters now:TELEMETRY_FILE=telemetry/{service}.jsonl{service}becomesticket-apiorticket-worker, so each process writes its own file.
Run it and read your own trace
Section titled “Run it and read your own trace”-
Start the simulator, the API and the worker in three terminals, as in Run the live service:
python -m simulator,fastapi dev,python -m ticket_api.worker. -
In a fourth terminal, send five practice tickets:
Terminal window python -m scripts.practice --tickets 5 --rate 2Sent 5 practice tickets in 2.0 s: 202: 5 -
Wait until the worker has logged five jobs. Its console lines now carry the request ID in brackets:
2026-10-11 04:16:31,538 INFO httpx [7e9a07239ab6]: HTTP Request: POST http://127.0.0.1:8300/v1/chat/completions "HTTP/1.1 200 OK"2026-10-11 04:16:31,760 INFO ticket_api.worker [7e9a07239ab6]: job 1: succeeded (attempt 1)The API’s console line for that ticket has the same ID:
INFO ticket_api [7e9a07239ab6]: POST /v1/tickets 202 …. Your IDs and times will differ. -
Stop the worker with Ctrl+C. The service writes telemetry in batches, and a worker that stops writes what is still waiting.
-
Read the summary of your two files:
Terminal window python -m ops summary telemetry/ticket-api.jsonl telemetry/ticket-worker.jsonlRecords: 10 logs, 110 spans, 42 metric records, from +0.0 min to +0.1 minTicket requests: 5 (202: 5)Tickets triaged: 5 (ok: 5)Prompt versions: assistant-v2 5Where the answers come from: replayed 5 (100.00%)Sent to a person (needs_human): 3 (60.00%)Agents' reviews (delayed labels): 0; answers to questions: 0Ten logs: two events per ticket. 110 spans: 22 per ticket. If Valkey still holds these tickets’ vectors from an earlier lesson, you see 19 spans per ticket: the next step shows why.
-
Print the trace of your first ticket as a waterfall, one row per span:
Terminal window python -m ops waterfall telemetry/ticket-api.jsonl telemetry/ticket-worker.jsonl --ticket T-500001Trace d2bdff5b10aa9b2c70503f7581b2054b, ticket T-500001: 22 spans, 2,846 ms from first to lastspan start ms ms cost US$POST /v1/tickets 0 14.9 #(waiting in the queue) 15 156.5 #process ticket job 171 2,674.9 #################################triage 175 2,458.8 ###############################chat chat-small 175 2,450.9 ############################## 0.000292POST 176 2,447.0 ##############################embed 2,633 209.3 ##cache get 2,634 6.0 #embeddings embed-small 2,640 194.1 ## 0.000002POST 2,640 191.4 ##cache set 2,834 1.5 #(12 database queries hidden; --all shows them)Longest step: triage, 2,459 ms (86% of the trace)Costliest step: chat chat-small, US$0.000292 of US$0.000293: 1903 tokens in, 203 out (101 of them reasoning), finish stop
Read a saved trace
Section titled “Read a saved trace”Each row of a waterfall is a span. start ms is when it began, counted from the start of the trace; ms is how long it took; the # bar draws both on one time scale. Indented rows are child spans. The row (waiting in the queue) is not a span: ops computes it from the gap between the API’s span and the job’s span. In this trace, the cache was empty, so the embedding called the provider (embeddings embed-small) and saved the vector (cache set). If your cache already had the vector, embed has only cache get, and no cost.
Without Docker, read a ticket from the saved telemetry. T-502401 is the first ticket of last week’s replay, answered with prompt v2:
python -m ops waterfall data/telemetry/release-full.jsonl.gz --ticket T-502401
Text description of the diagram
The API’s span is a thin bar at the start: 35 milliseconds. The dashed bar is the queue: 192 milliseconds. Then the job’s span opens and holds the rest. Inside it, triage and its call chat chat-small fill 2.7 of the 3.0 seconds, and the call carries the only real cost, US$0.000308. The embedding is a small bar at the end: its vector came from the cache, so it cost nothing.
You already met this shape in the scaling course: the provider’s calls are almost all of a ticket’s time. The Server-Timing header showed it for one request. The trace shows it across two processes and the queue, and it adds the tokens and the cost.
Optional: the same telemetry in Grafana
Section titled “Optional: the same telemetry in Grafana”Files are enough for this course. A team usually wants a backend that stores telemetry and draws it, so that everyone looks at the same live view. The course uses Grafana in one container, grafana/otel-lgtm:0.36.0. It holds an OpenTelemetry Collector, Prometheus for metrics, Tempo for traces, Loki for logs, and Grafana to show them.
-
Start the container. It is in
compose.yamlunder the profileobservability, so the other commands do not start it:Terminal window docker compose --profile observability up -d observability -
In
.env, setOTEL_EXPORTER_OTLP_ENDPOINT=http://127.0.0.1:4318. Restart the API and the worker. They now send telemetry to the files and to the collector. -
Open
http://127.0.0.1:3000. The dashboards are in the folder Ticket service. The files inobservability/define them, and the alert rules too. -
Stop the container when you finish:
docker compose --profile observability stop.
On the course team’s computer, the image was an 855 MB download. The container was ready 5 seconds after it started, and it used 1.2 GB of memory then. It grew to 2.45 GB after about three hours of stored telemetry. The screenshots in this module come from the course team’s runs.
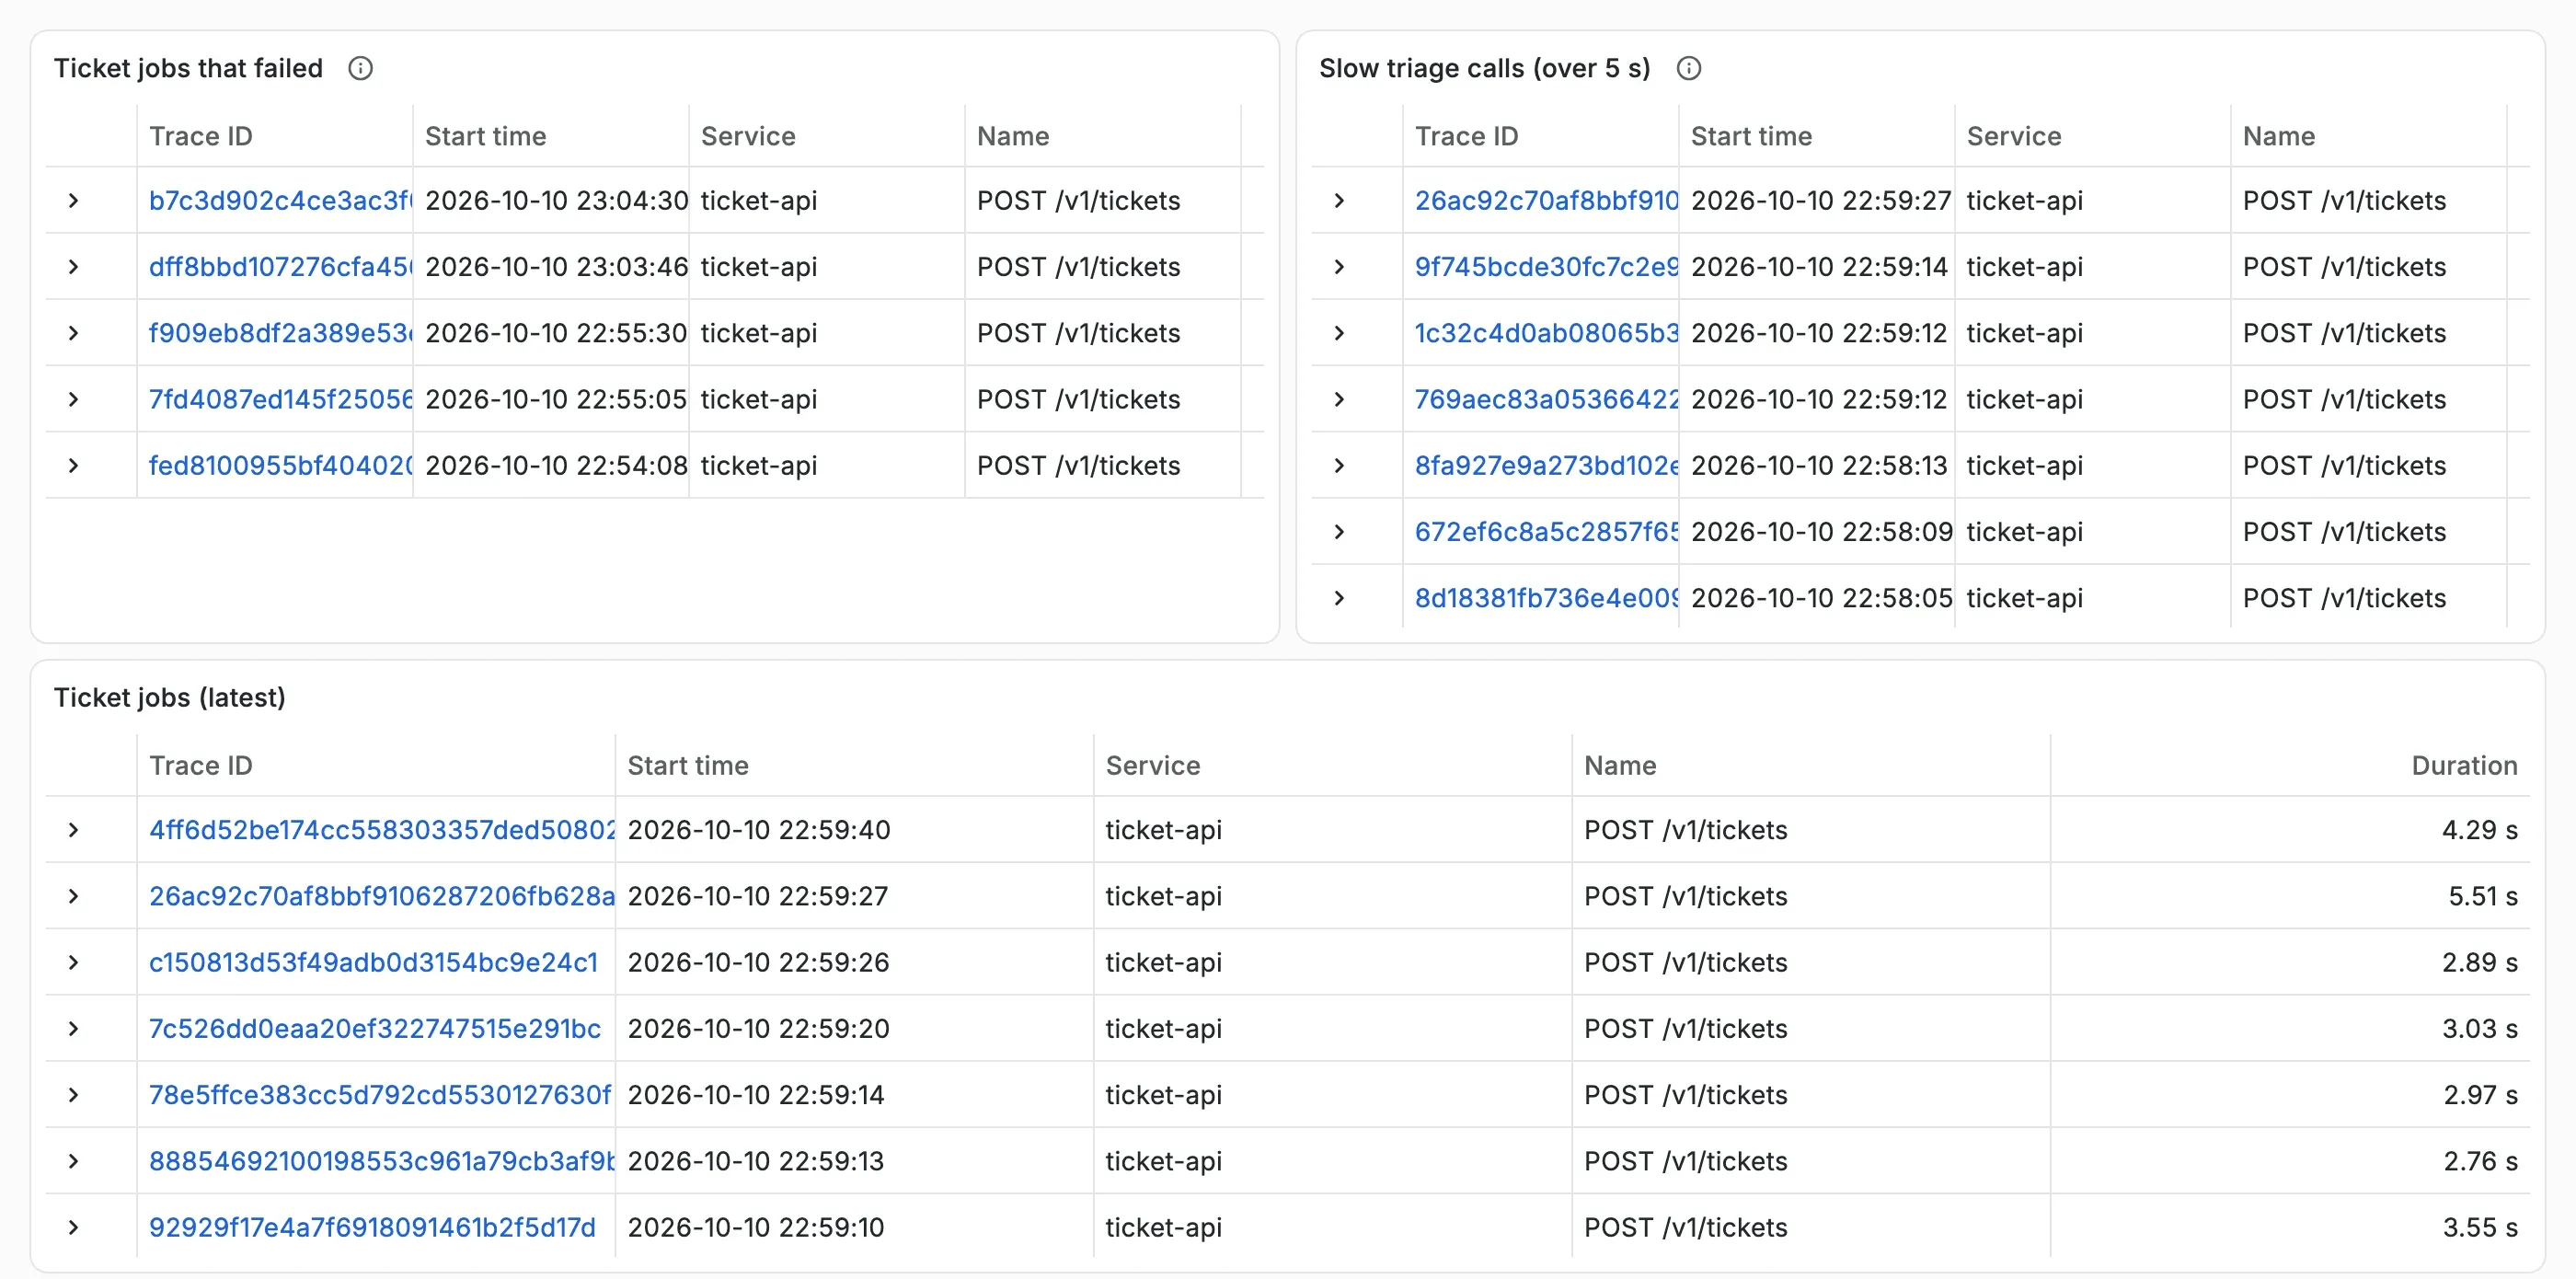
Each row is a trace, named after its first span, POST /v1/tickets: the trace starts at the API even when the slow part is in the worker. The last panel lists ticket.triaged events with the severity ERROR: the logs of tickets without a valid answer.
When to add telemetry, and what it costs
Section titled “When to add telemetry, and what it costs”Sam asks, “Why not keep every line that the code logs, and search them later?”
Amira answers: “We tried that first. Python’s log lines have no fixed names, so a dashboard cannot count them. And the first version also exported the full path of each source file on the developer’s computer. Events with fixed names say what we need and nothing else.”
Add telemetry as soon as a service has users and more than one process. Decide the event names and the metric labels first. They are a contract: dashboards, alerts and ops read them, and docs/telemetry.md lists them. Without that list, each change of a name breaks a chart without warning.
Telemetry costs time on each request. The course team measured POST /v1/tickets: a median of 2.39 ms with telemetry off, and 3.66 ms with every trace kept. One worker finished 238 jobs a second with telemetry off, and 201 with every trace: 16% fewer. That was measured with a simulator that answers at once. With real AI calls of 3 seconds, a millisecond is lost in the noise, but the cost still exists. It also costs storage and care: someone must keep the names stable and keep private text out. The last lesson of this module measures these costs and reduces them.
Do not add telemetry that nobody will read. For a script that runs once, a print statement is enough.
Common mistakes
Section titled “Common mistakes”Common mistake
ops: no file telemetry/ticket-api.jsonl
Symptom: after you send tickets, ops summary prints:
ops summary: no file telemetry/ticket-api.jsonlCause: your .env was made from an earlier .env.example, so it has no TELEMETRY_FILE. With no file and no endpoint, the service starts no telemetry, and it runs as before.
Diagnose: the telemetry folder does not exist, but the worker’s console lines have the request ID in brackets. The request ID comes from the code, not from the telemetry setting.
Fix: copy the telemetry block from .env.example to your .env, as in step 6 of the setup. Restart the API and the worker, then send the tickets again.
Common mistake
The last tickets are missing from the file
Symptom: you run ops summary while the worker still runs, and it counts fewer triaged tickets than you sent.
Cause: the service writes telemetry in batches, so a slow file write never delays a ticket. In this project, spans and logs go out about every 2 seconds, and metrics every 15 seconds (TELEMETRY_METRIC_INTERVAL_MS).
Fix: wait a few seconds, or stop the worker with Ctrl+C: it writes everything that waits before it stops. If the process is killed, the last batch is lost. The same is true in production, so stop workers gently.
Knowledge check
Section titled “Knowledge check”Check your understanding
Grace asks three questions: how many tickets got no answer with prompt v3 this week; why did ticket T-65663 wait; and where did the 9 seconds of one slow ticket go? Which signal answers each one?
Show the answer
The count comes from a metric: app.tickets.triaged with the labels outcome and prompt.version counts every ticket, never sampled. Why one ticket waited comes from the logs: its ticket.received and ticket.triaged events, with the outcome, the finish reason and the error type. Where the 9 seconds went comes from its trace: the waterfall shows each span’s start, duration and cost. The trace ID and the request ID join the second answer to the third.
Does your answer have the main points of ours?
Sign in and enroll in the course to save your answers. Every check counts toward the certificate.
Check your understanding
Predict: the ticket's job waits in the database between the API and the worker. Without the trace_context column, what would the trace of a ticket look like?
Show the answer
The ticket would have two traces. The API’s trace would hold only POST /v1/tickets and its database queries, about 15 ms. The worker would start a new trace for process ticket job, with the triage call and the embedding. Nothing would show the queue wait, and the API’s request would never connect to its AI call. The traceparent saved with the job is what makes it one trace.
Does your answer have the main points of ours?
Sign in and enroll in the course to save your answers. Every check counts toward the certificate.
Check your understanding
Practical check: send five practice tickets with TELEMETRY_FILE set. What do ops summary and ops waterfall show for your first ticket?
Show the answer
python -m ops summary telemetry/ticket-api.jsonl telemetry/ticket-worker.jsonl prints Ticket requests: 5 (202: 5) and Tickets triaged: 5 (ok: 5). python -m ops waterfall … --ticket T-500001 prints one trace with spans from both services: POST /v1/tickets, the queue wait, process ticket job, triage with chat chat-small and its cost, and embed. The longest step is triage, more than 80% of the trace. Your times will differ. Without Docker, --ticket T-502401 on data/telemetry/release-full.jsonl.gz gives the same shape: 3,006 ms, and the triage call costs US$0.000308.
Does your answer have the main points of ours?
Sign in and enroll in the course to save your answers. Every check counts toward the certificate.
Recap
- Telemetry has three signals. Logs are events with fixed names, metrics count every ticket, and a trace is the tree of spans of one ticket.
- The trace ID and the request ID join them. The job saves the request’s traceparent, so one trace crosses the queue from the API to the worker.
- Each AI call is a span with the GenAI attributes (model, tokens, finish reason), still “development” in OpenTelemetry, and the service’s cost estimate.
TELEMETRY_FILEsaves everything to JSON lines forpython -m ops. Grafana is optional, and the files show the same numbers.
Next, you compare prompt v2 and prompt v3 with these signals: outcomes, tokens, time and cost for each version. You also find the slow, expensive step in a trace.
Next: Quality and costs