
What a purpose-built view adds
- Lesson 28
- 35 min
- Module 8: Tools: Langfuse, others and the run inspector
Where we are
In the last lesson, we compared general tools on stated criteria and saw where each one is strong. Some questions are still slow to answer in any of them, such as the story of one run for an auditor. In this lesson, we tour the run inspector, read how one of its failure flags is computed, and decide which views our team needs. We start in a hospital.
Lesson 28 of 28 · Observability for AI Agents: Traces, Costs and Audit TrailsWhat a purpose-built view adds
1. Why agents need their own observability
2. OpenTelemetry for agents
3. Instrument the workflow
4. Find agent failures in Grafana
5. Cost
6. Audit trails
7. Alerts, service levels and quality
8. Tools: Langfuse, others and the run inspector
What you will be able to do
See what a small view built only for agent runs answers faster than Grafana or Langfuse. Then check how one of its flags works, and decide which views your team needs.
Before you startWhat to know and to have ready
What you need to know
- The five failure patterns and their flags, from Agent failure patterns.
- The audit story of a run, from Answer an audit question.
- The tools compared in Choose tools for a team.
What you need on your computer
- The labs folder
nextia-learning-labs/C31/inspector, beside your project, and Python 3.12 or later. The inspector uses the standard library only, so your project’s virtual environment works. No Node.js, no Docker and no account. - A browser. The inspector runs on your computer only, at
127.0.0.1, and sends no data anywhere.
Tested on macOS (Apple silicon) with Python 3.12.13. The Windows and Linux commands are written, not run. The run inspector is a reference app of this course: you use it and read its code, you do not build it.
Three papers about one patient
Section titled “Three papers about one patient”In a hospital, one patient has three papers. The nurse’s chart shows the pulse and temperature every hour, and it warns when a number goes out of range. The lab report shows each test and its result. And when the patient goes home, the doctor writes a discharge letter for the family. It says what happened, what was done, who decided, and what to do next, in plain words.
All three come from the same facts. But the family cannot read the chart, and the nurse does not need the letter. Each paper is written for one reader and one question.
The problem: Grace’s question in a general tool
Section titled “The problem: Grace’s question in a general tool”Grace leads support and approves refunds. She asks Amira one question about the double refund: “Did we pay the customer on T-90104 twice, and who approved it?”
Amira can answer it in Grafana. She writes the TraceQL query for a duplicate write, opens trace 2, reads two execute_tool request_refund spans, and compares their attributes. Then she follows the span link back to trace 1 for the proposal. She can answer it in Langfuse, too, from the session. But Grace cannot do either: she does not read TraceQL or span attributes. And neither tool says whether the audit trail is intact, which is the first thing an auditor asks.
So every audit question goes through an engineer. The answer exists in the data, but nobody wrote the “discharge letter”.
The idea: a small view for one kind of reader
Section titled “The idea: a small view for one kind of reader”A purpose-built view is a small app that reads the same data as the general tools. It answers a few fixed questions for one kind of reader. It does not replace Grafana or Langfuse. It reads the same OpenTelemetry spans and the same audit trail, with the same rules, and it shows them in the reader’s words.
The course’s run inspector is one. It has five screens: Runs, Run, Audit, Cost and Compare. It is read-only, and it has no evaluations, alerts or accounts on purpose: those belong to the general tools.
Start the inspector
Section titled “Start the inspector”-
Open a terminal in the labs folder of the inspector:
Terminal window cd ../nextia-learning-labs/C31/inspectorTerminal window cd ..\nextia-learning-labs\C31\inspectorTerminal window cd ../nextia-learning-labs/C31/inspector -
Start it on its built-in data, the replayed week:
Terminal window python -m larkfield_inspectorRun inspector 1.0.0 on http://127.0.0.1:8318/ (saved mode: the built-in replayed week).The saved data is a replayed week: real recorded model decisions from the agents course, constructed traffic and practice incidents. No data leaves this computer.Press Ctrl+C to stop.Your browser opens on the Runs screen. If it does not, open
http://127.0.0.1:8318/. -
Keep this terminal open. Press Ctrl+C in it when you are done.
A tour of the five screens
Section titled “A tour of the five screens”Runs: the flagged runs of the week
Section titled “Runs: the flagged runs of the week”On the Runs screen, set Flag to Any flag:
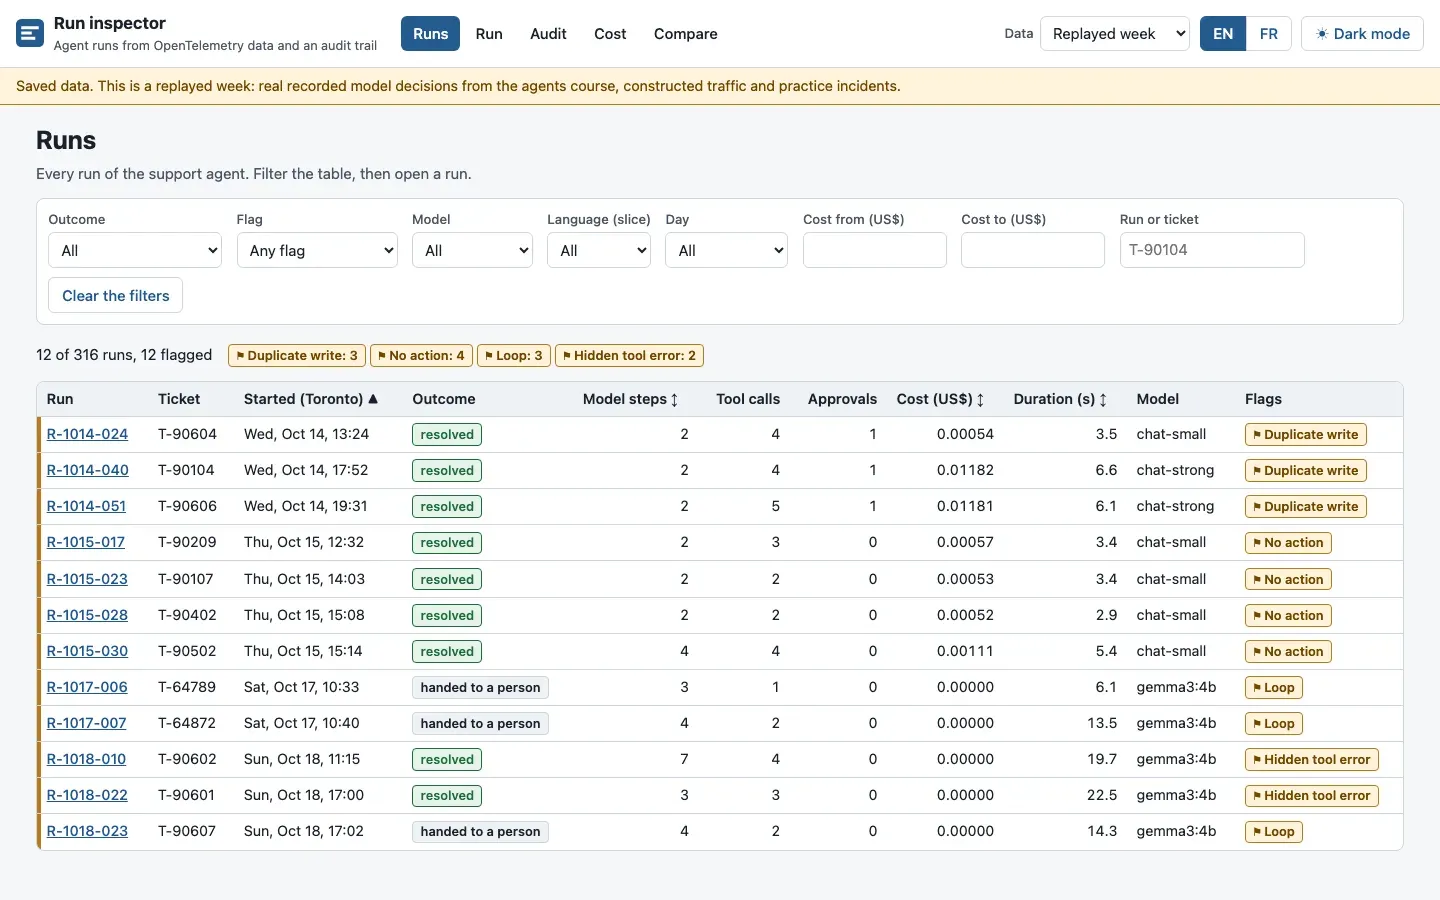
These are the same 12 runs that python -m obs find all found in Module 4. They must be: the inspector’s flag code is a copy of the project’s obs/flags.py, checked by a test. Two of them are not real failures by the scenario truth: R-1014-024 (duplicate write) and R-1018-022 (hidden tool error). You meet the first one again below.
Run: why a run is flagged
Section titled “Run: why a run is flagged”Open R-1014-040:
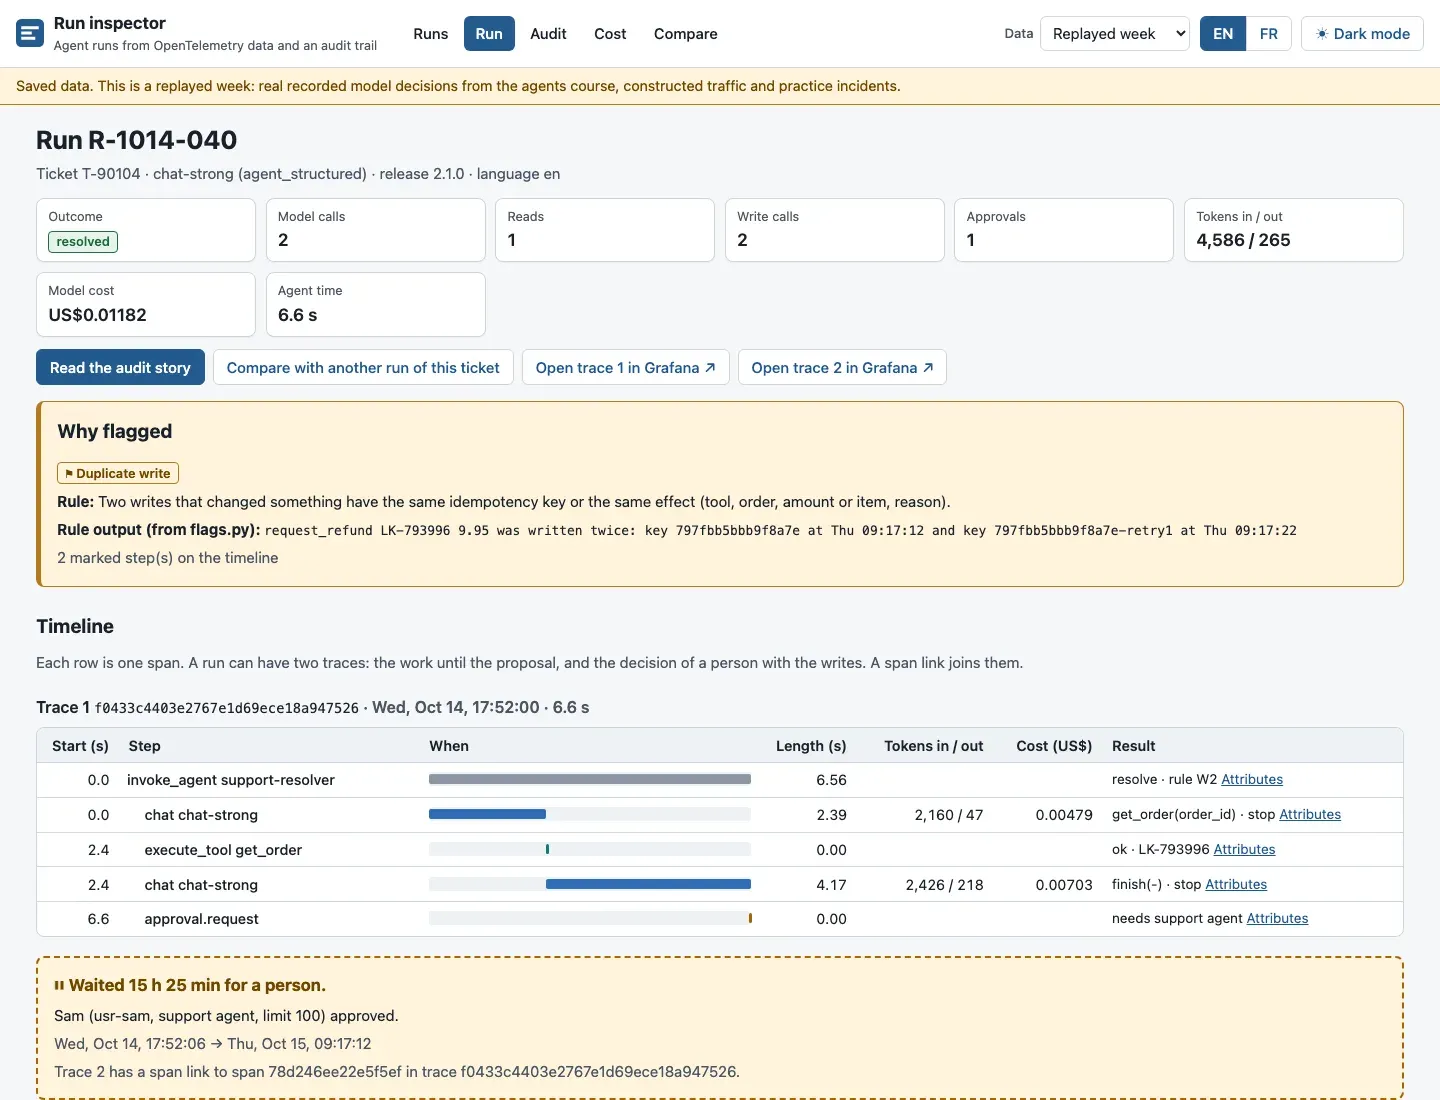
The screen answers Grace’s first half in one sentence: the refund of 9.95 on LK-793996 was written twice, with two keys, ten seconds apart. Below it, the timeline shows both traces, and the wait of 15 h 25 min for Sam as a box, not a bar. The buttons open the same traces in Grafana, and in Langfuse when you set LANGFUSE_URL.
Audit: the discharge letter
Section titled “Audit: the discharge letter”Select Read the audit story:
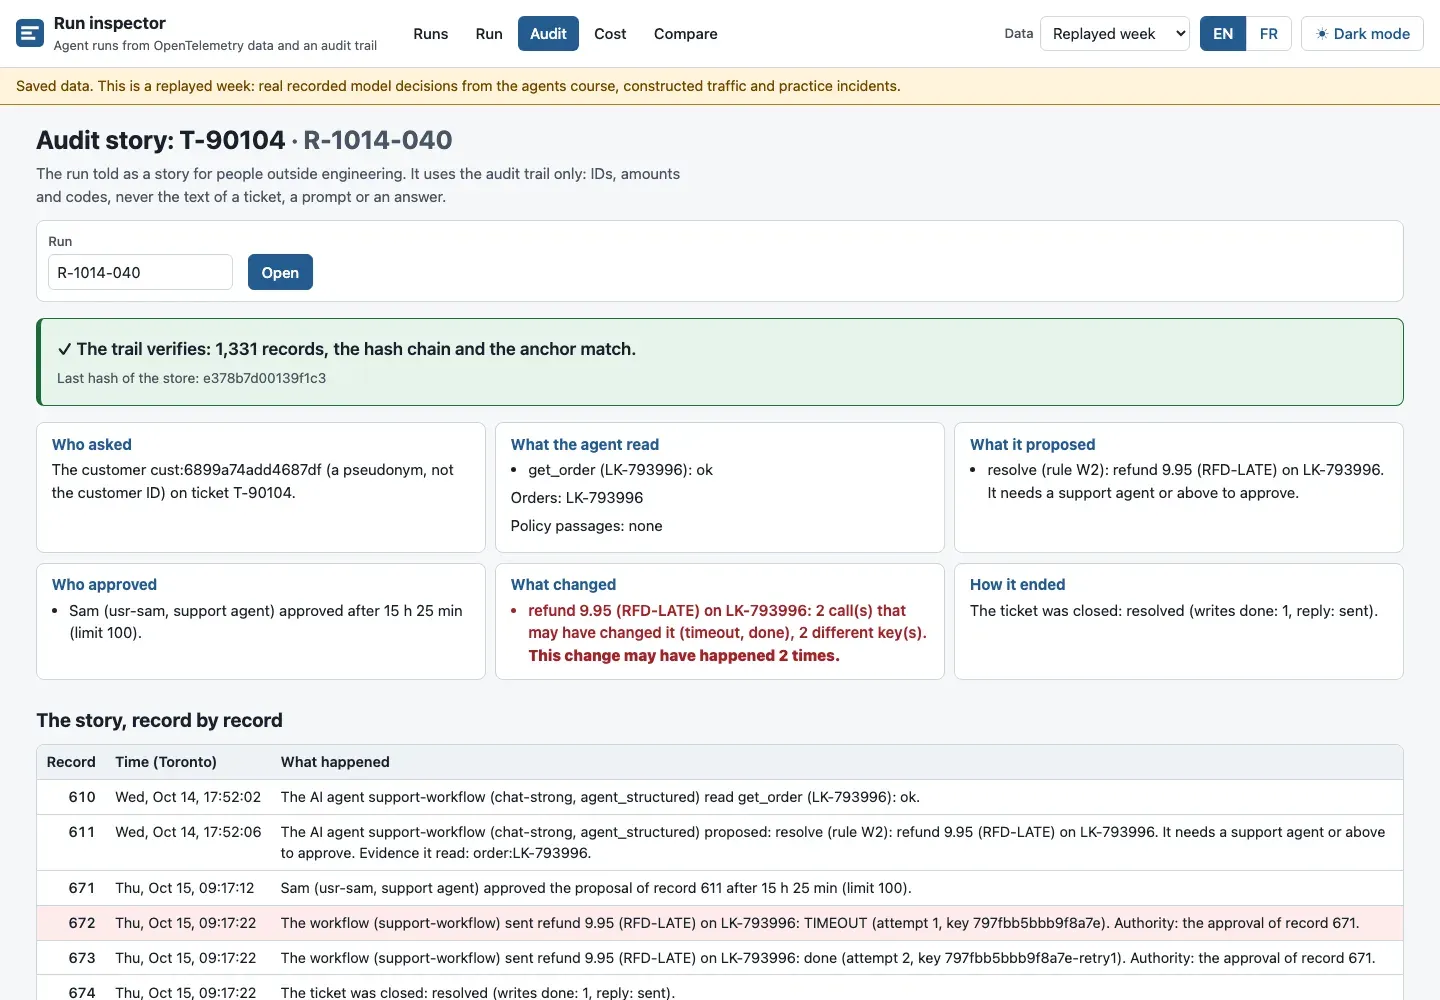
This screen is for Grace and for an auditor. It reads the audit trail only, not the traces. It shows who asked, what the agent read and proposed, who approved with which role and limit, and what changed. It starts with the chain check: 1,331 records, head e378b7d00139f1c3, the same as obs audit verify. The red card answers the second half of Grace’s question: Sam approved once, and the change may have happened twice.
Cost: a number that leads to a decision
Section titled “Cost: a number that leads to a decision”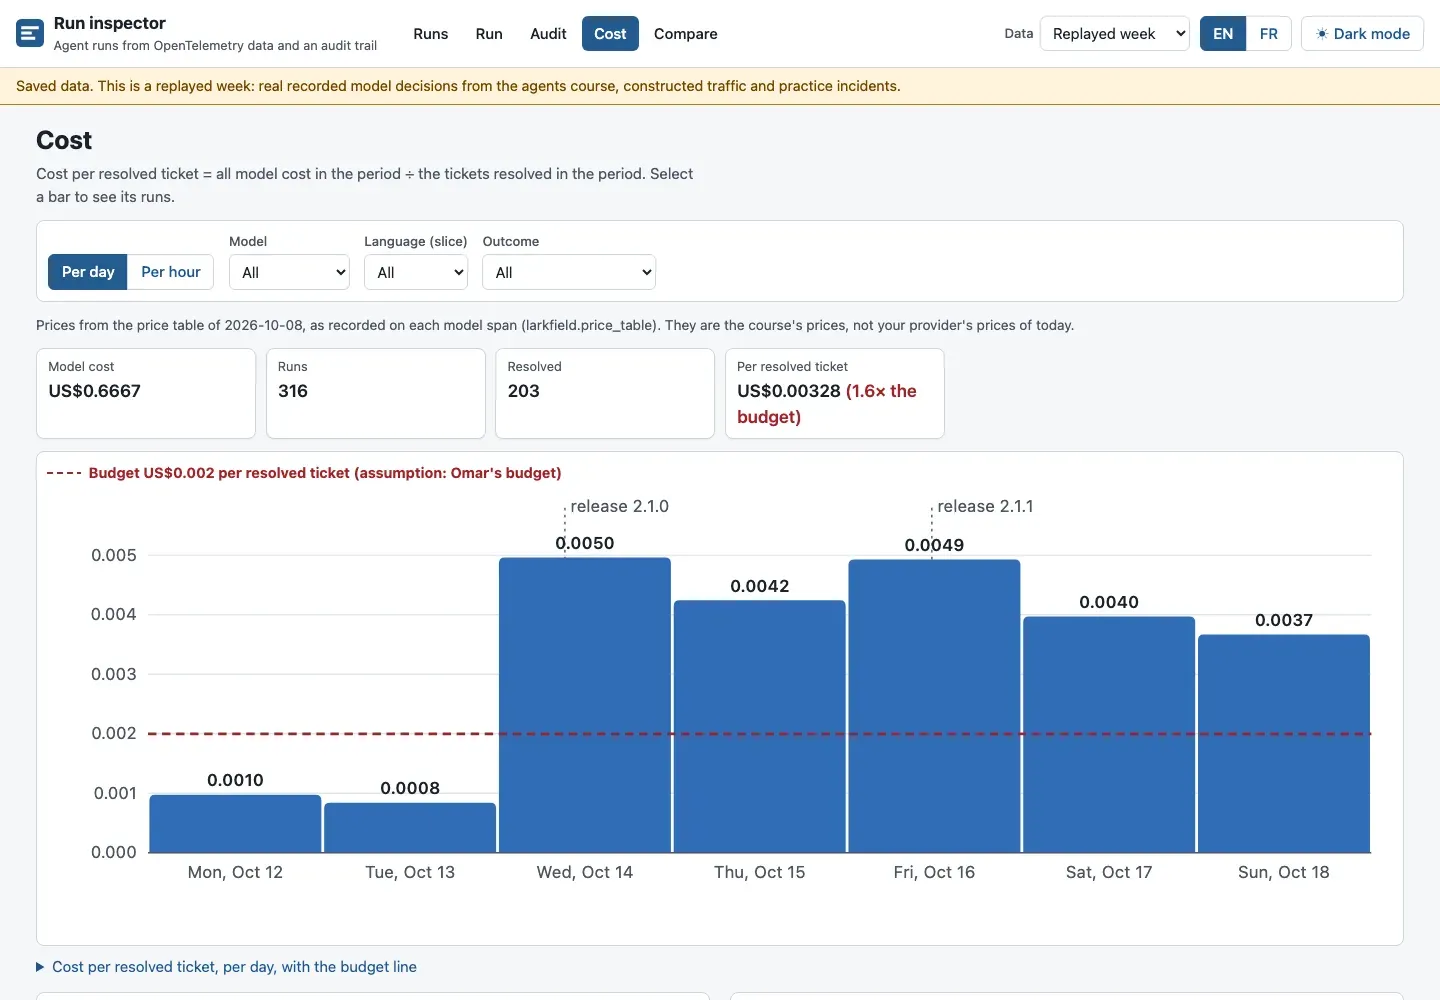
Module 5 asked “did the switch to chat-strong pay?”. This screen puts the answer in Omar’s words: cost per resolved ticket, not per call, against his budget, with the release of the switch marked on Wednesday. US$0.00328 for the week, 1.6 times the budget. Select Wednesday’s bar, and the Runs screen opens on Wednesday’s runs. The prices are the dated table on each span, and the screen says so.
Compare: where two runs went apart
Section titled “Compare: where two runs went apart”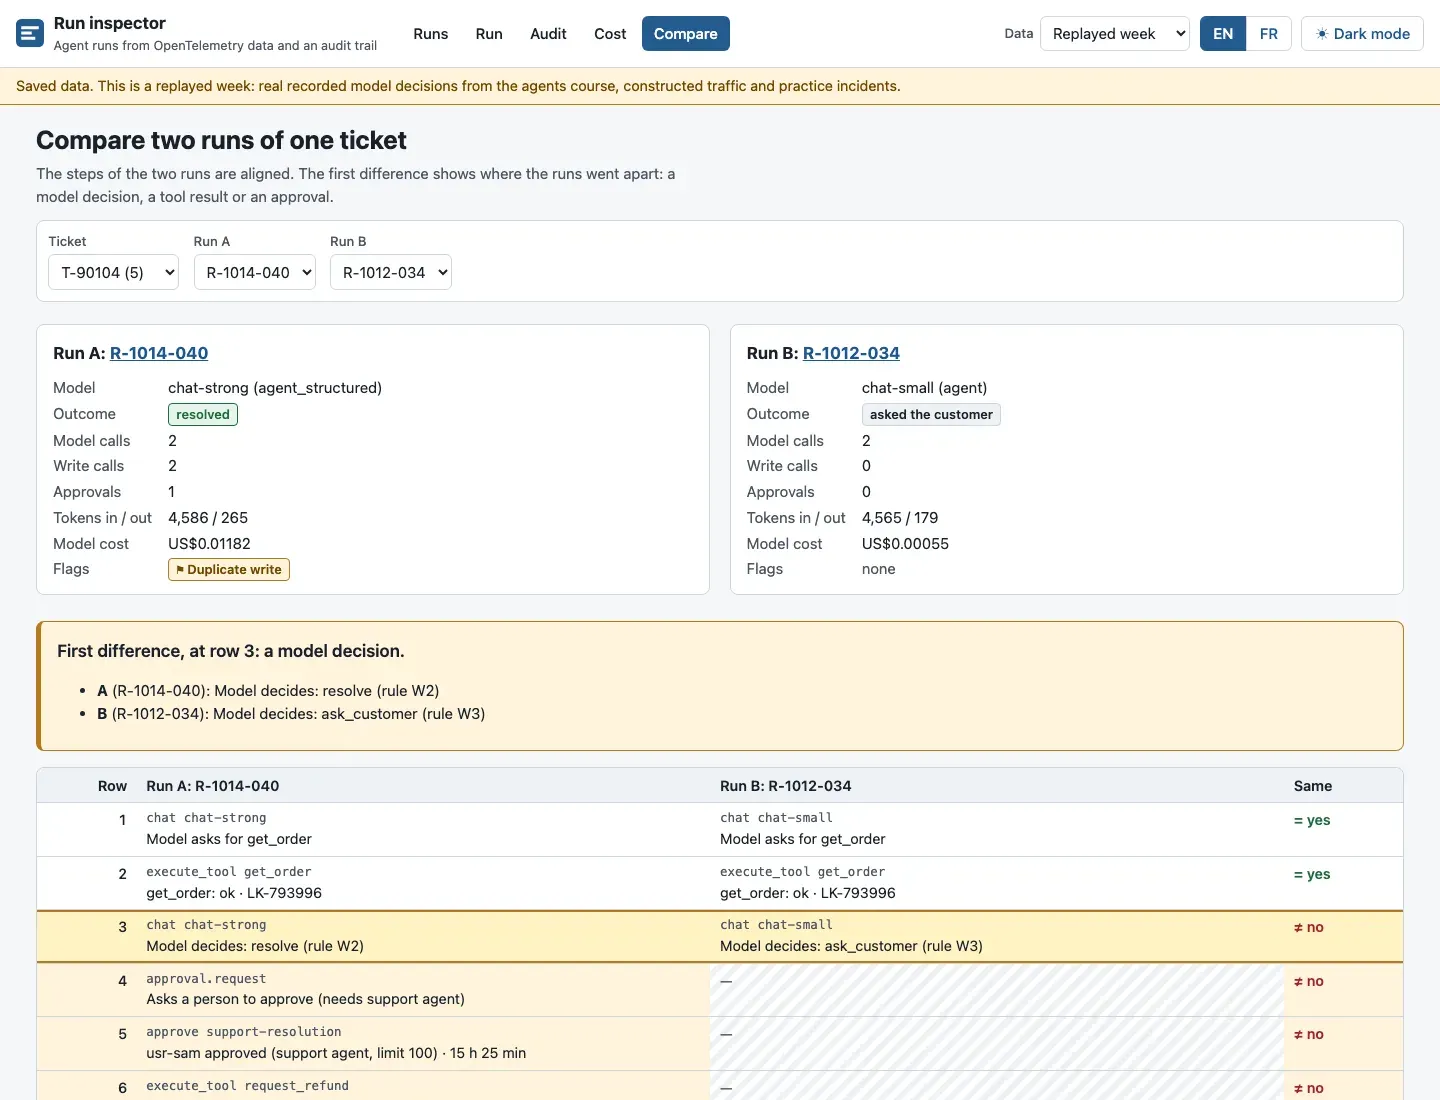
The same ticket ran five times in the week. Its chat-small twin, R-1012-034, read the same order and then asked the customer. The strong model proposed the refund. So the double refund needed three things together. They were the model’s decision, the approval and the naive retry. Compare finds the first one in one screen.
How one flag is computed
Section titled “How one flag is computed”A view that says “flagged” must show why, or nobody should trust it. Each flag is one short function in obs/flags.py, copied unchanged into the inspector. Here is the duplicate write rule, step by step, on the double refund.
A tiny worked example
Section titled “A tiny worked example”The rule takes each write span of a run. It asks two questions of each one: did it change something, and has an earlier write already made the same change? Run the rule’s two helpers on R-1014-040 in your project folder:
python -c "from obs.model import Telemetry; from obs.flags import _changed, _effect; r = Telemetry('data/telemetry/week').runs['R-1014-040']; [print(s.get('larkfield.idempotency_key'), s.get('larkfield.write.outcome'), _changed(r, s), _effect(s)) for s in r.writes]"797fbb5bbb9f8a7e timeout True ('request_refund', 'LK-793996', 9.95, None, None, 'RFD-LATE')797fbb5bbb9f8a7e-retry1 done True ('request_refund', 'LK-793996', 9.95, None, None, 'RFD-LATE')Read the two lines:
- The first write timed out. Did it change something? A reconcile span, the check that asks the payment service, would say. This run has none, because the naive retry skips it. So the rule cannot know. It answers
Trueand counts the write, to be on the safe side. - The second write is done, so it changed something:
True. - The effect is the tool, the order, the amount or item and the reason. Both lines have the same effect:
request_refund,LK-793996,9.95,RFD-LATE. - The keys differ, but the effects are equal. So the rule flags the run, and returns the sentence that you saw on the Run screen.

Text description of the diagram
The rule has one guess, the dashed box. A write that timed out may or may not have happened, and the trace cannot tell. The rule counts it, because a missed double payment costs more than a false alarm. Every other step reads attributes that the spans carry: the write’s outcome, its key and its effect.
The flag’s false positive
Section titled “The flag’s false positive”Now run the same line on R-1014-024, the run that the scenario truth does not count as a double write:
python -c "from obs.model import Telemetry; from obs.flags import _changed, _effect; r = Telemetry('data/telemetry/week').runs['R-1014-024']; [print(s.get('larkfield.idempotency_key'), s.get('larkfield.write.outcome'), _changed(r, s), _effect(s)) for s in r.writes]"2ed3b2a93ab0f494 timeout True ('create_return_label', 'LK-645334', None, 'LADDER-3', None, 'change_of_mind')2ed3b2a93ab0f494-retry1 done True ('create_return_label', 'LK-645334', None, 'LADDER-3', None, 'change_of_mind')The trace looks the same as the double refund: a timeout, then the same effect with a new key. But here the label service timed out before it made the label, so the retry made the only one. The rule guessed “changed”, and was wrong.
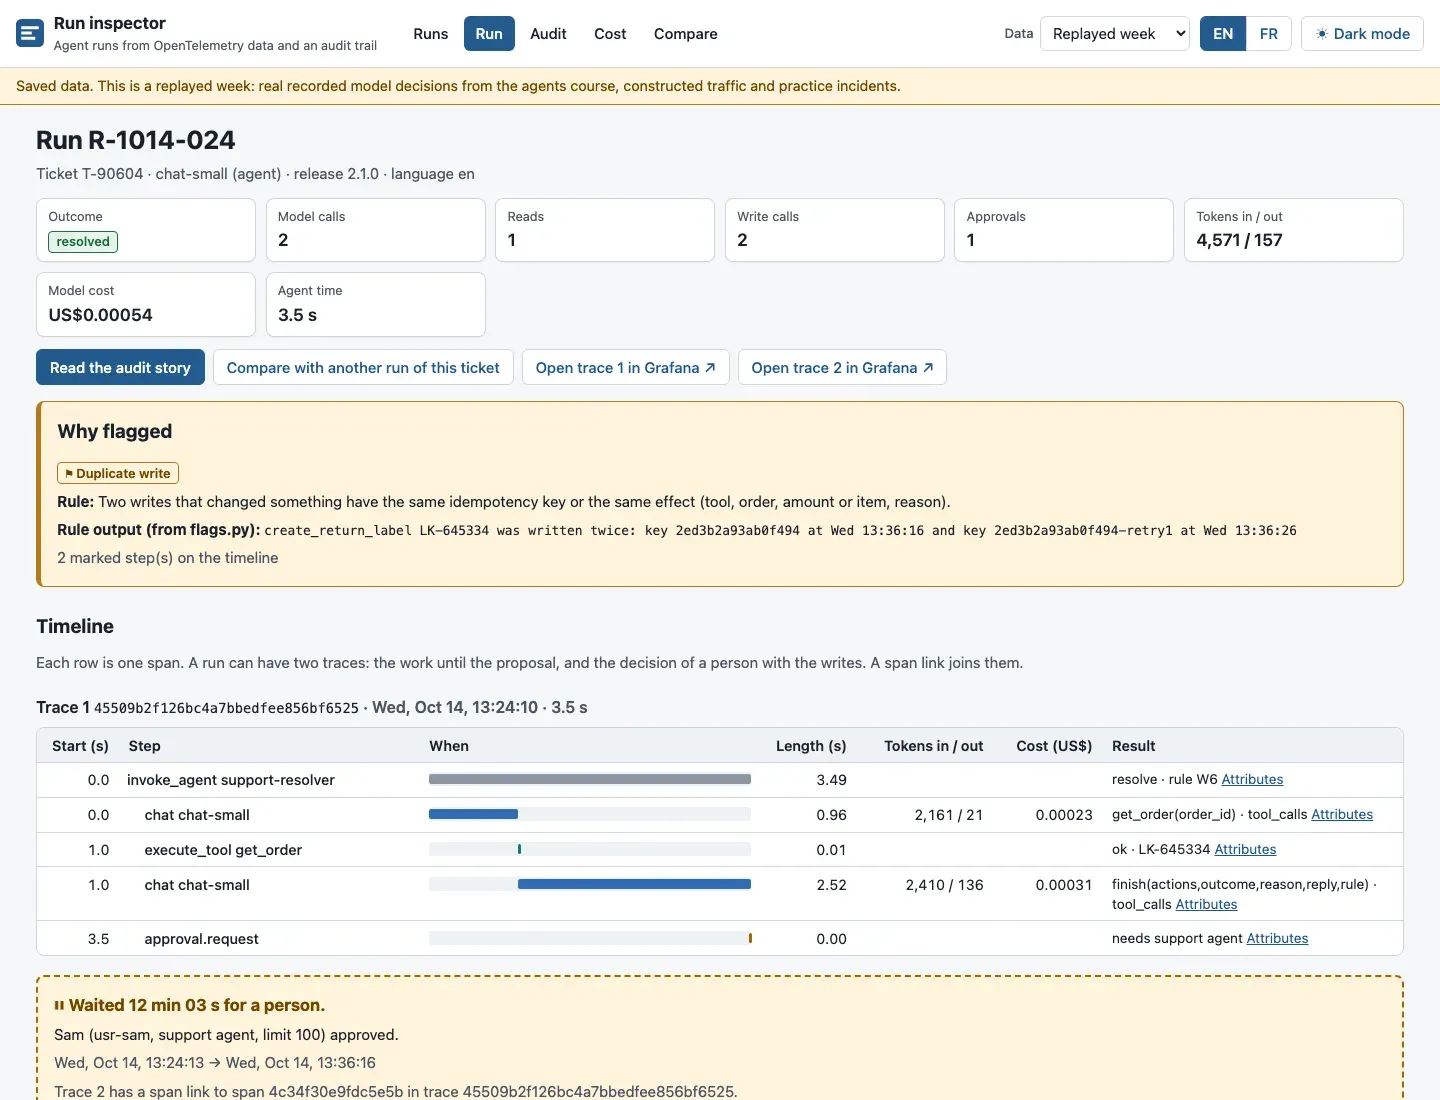
So the flag is a reason to look, not a verdict. A trace cannot tell whether a timed-out write happened. The audit trail cannot either: it records the call and its timeout. Only the system of record, the service that made the change, knows. That is why the audit story says “may have happened 2 times”, and why the safe retry of Module 3 asks the payment service before it writes again. This is the lesson of Agent failure patterns, seen from the view.
On the week, the duplicate write flag fired on 3 runs, and 2 were true. On the healthy week, python -m obs find all --data data/telemetry/healthy-week gives 0 match(es) in 316 run(s), as the inspector shows for the Healthy week data set.
Which views does your team need?
Section titled “Which views does your team need?”Each view answers a few questions fastest. Map your team’s questions before you build anything:

Text description of the diagram
Grafana answers the system questions: is something wrong now, and where. Langfuse answers the model questions: what each call did, and how the reviews scored it. The inspector answers the questions of people outside engineering, and the comparisons that no general tool has a screen for. Some questions have two good answers. A question that has no fast answer is the reason to build a view.
When a purpose-built view is worth it, and what it costs
Section titled “When a purpose-built view is worth it, and what it costs”Build one when the same question comes back every week from people who cannot use the general tools, as Grace’s audit questions do. Do not build one for a question that a dashboard or a saved query answers. And never put a feature in it that a general tool already does well, such as alerts.
The cost is ownership. The inspector is small: Python’s standard library and prebuilt web pages. But it reads the GenAI names, and they are still in development. When the course pins a new version of the conventions, the inspector must change with it. Its flag code is a copy, so a test checks the copy against the project: two places with the same rule must never disagree. Someone at Larkfield must own it, as Kwame owns the price table.
Common mistake
The inspector does not start: the port is in use
Symptom: python -m larkfield_inspector stops at once with this message:
Cannot listen on 127.0.0.1:8318 (Address already in use). Another program uses the port? Try --port 8319, or set INSPECTOR_PORT.Cause: another program listens on port 8318, often a second inspector that you started in another terminal and forgot.
Diagnose: find the other terminal and look for the line Run inspector 1.0.0 on http://127.0.0.1:8318/. On macOS and Linux, lsof -i :8318 names the program. On Windows, Get-NetTCPConnection -LocalPort 8318 shows its process ID.
Recover: stop the other inspector with Ctrl+C in its terminal. Or start this one on another port: python -m larkfield_inspector --port 8319, and open http://127.0.0.1:8319/.
Your turn: one question, three views
Section titled “Your turn: one question, three views”Take Grace’s question: “Did we pay the customer on T-90104 twice, and who approved it?”
- Grafana. If you ran the week in Grafana, use the duplicate write query of Search runs with TraceQL, open the trace, and find the approver. Without Docker, use
python -m obs find duplicate_write --data data/telemetry/weekandpython -m obs trace R-1014-040 --data data/telemetry/week. - Langfuse. If you sent the week, open the session
R-1014-040. Without an account, read the recorded answer in Send the same traces to Langfuse. - The inspector. Open the Runs screen, then the Audit screen of R-1014-040.
- For each view, write down how many steps you needed, and which part of the question it could not answer.
- Write three sentences: which view answered fastest, why, and which view you would send to Grace.
There is no single right answer. A worked comparison is in the third knowledge check.
Knowledge check
Section titled “Knowledge check”Check your understanding
The Run screen flags R-1014-024 as a duplicate write, but the scenario truth says that only one label was made. Is the rule wrong? What decides, and why does the rule guess the way it does?
Show the answer
The rule did what it says: two writes with the same effect, and the first one timed out with no reconcile. A trace cannot tell whether a timed-out write happened, and the audit trail cannot either: both record the call and its timeout. Only the system of record knows, here the label service, by its own records or by a reconcile that asks it. The rule counts an unknown write as a change because a missed double payment costs more than a false alarm. So the flag means “look here”, and a person checks the system of record before acting. On the week: 3 flagged, 2 true.
Does your answer have the main points of ours?
Sign in and enroll in the course to save your answers. Every check counts toward the certificate.
Check your understanding
Tomás says: 'The inspector does what Grafana does. Let us add alerts and evaluations to it, then we can drop Grafana and Langfuse.' What do you answer?
Show the answer
No. The inspector is useful because it is small and answers a few questions for a few readers: the audit story, cost per resolved ticket, run comparison and flags. Alerts need a rule engine that runs all the time, notifies people and has a history: Grafana does that well. Evaluations need scores, judges, datasets and review queues: Langfuse does that. Each feature added to the inspector is code that Larkfield must own and change with every new version of the GenAI conventions. Keep the general tools for general questions, and the view for what they answer slowly.
Does your answer have the main points of ours?
Sign in and enroll in the course to save your answers. Every check counts toward the certificate.
Check your understanding
Your turn: which view answered Grace's question fastest, and why?
Show the answer
One worked comparison. Grafana: a TraceQL query, then trace 2 for the two refund calls, then the span link to trace 1 for the proposal: about four steps. It needs TraceQL, and it says nothing about whether the audit trail is intact. Langfuse: the session R-1014-040 shows both traces and the two refund observations: about two steps. But the approver is in metadata, and there is no chain check. The inspector: the Runs screen with the flag filter, then the Audit screen: two steps. It answers in plain words (Sam approved once, the refund may have happened twice), and it verifies the trail first. Send Grace the inspector’s audit story, or its Markdown export. For Amira’s next question, “why did the model propose it?”, Grafana or Langfuse is the better place.
Does your answer have the main points of ours?
Sign in and enroll in the course to save your answers. Every check counts toward the certificate.
Recap
- A purpose-built view reads the same OpenTelemetry data and audit trail as the general tools, and answers a few questions for one kind of reader.
- The run inspector’s five screens: Runs, Run (why flagged), Audit (the story, the chain check first), Cost (per resolved ticket, against the budget) and Compare (the first difference).
- Each flag is one short rule that shows why. The duplicate write rule counts a timed-out write as a change. So it has a known false positive, and only the system of record decides.
- Map your team’s questions to views. Build a view only for a question that comes back often and is slow in every general tool, and give it an owner.
- In this course, you recorded once with OpenTelemetry. You sent the same data to three destinations: Grafana, Langfuse and the audit store. Any view can read it.
You have now built, read and compared the whole observability of one agent workflow. But it was always our own workflow, with our own names. Next, in the case studies, you take public agent runs that someone else recorded, convert them to OpenTelemetry, and find their failures.