
Read a run
- Lesson 12
- 35 min
- Module 4: Find agent failures in Grafana
Where we are
In Module 3, we made the workflow record every model call, tool call, write and approval as a span, and we joined the two traces of a run with a link. But having traces is not the same as reading them. Sam asks which step was slow and which step cost the money, and the totals cannot say. In this lesson, we read the waterfall of one agent run, step by step. We start with a parcel's tracking page.
Lesson 12 of 28 · Observability for AI Agents: Traces, Costs and Audit TrailsRead a run
1. Why agents need their own observability
2. OpenTelemetry for agents
3. Instrument the workflow
4. Find agent failures in Grafana
5. Cost
6. Audit trails
7. Alerts, service levels and quality
8. Tools: Langfuse, others and the run inspector
What you will be able to do
Read the waterfall of one agent run: what each row is, which step was slow, and which step cost the money. Find where the run waited and which step made a change. Then read your own run the same way.
Before you startWhat to know and to have ready
What you need to know
- Spans, traces and the parent of a span, from Spans, traces and context.
- The model, tool and write spans, and the two linked traces of a run that waits for a person, from Approvals, people and waiting time.
What you need on your computer
- The project
~/projects/observable-workflowas Module 3 left it: the same as the snapshotend-of-m03.python -m pytest -qends with86 passed, 1 skipped, 1 deselected. - A terminal in the project, with the virtual environment active.
This lesson adds no file. You need no account and no Docker. Grafana is optional. Tested on macOS (Apple silicon) with Python 3.12.13. The commands are the same on Windows and Linux, and the course did not run them there.
A parcel’s tracking page
Section titled “A parcel’s tracking page”You order a lamp. The shop gives you a tracking page. It has one line per event. “Picked up, Monday 14:02.” “Arrived at the depot, Monday 18:40.” “Out for delivery, Wednesday 08:15.” “Delivered, Wednesday 11:30.” You never see the lorry, but you can read the trip.
You read it in a fixed way. The lines are in time order. The space between two lines tells you where the parcel waited: a whole day at the depot, and nothing happened. If the parcel came late, you do not blame “the trip”. You find the line where the time went.
A trace of an agent run is the same kind of page, with one difference: you see it as a picture. Each step is a bar on a time line.
The problem: totals hide the step
Section titled “The problem: totals hide the step”In Module 3, run R-1014-040 became a trace. This is the double refund of ticket T-90104. Its first lines give the totals:
Run R-1014-040 | ticket T-90104 | chat-strong (agent_structured) | release 2.1.0 | language en2 model call(s), 1 read(s), 2 write call(s), 4586 tokens in, 265 out, US$0.01182Sam, who approved the refund, asks three questions. “Which step took the time? Which step cost the money? And why did the customer wait until the next morning?” The totals cannot answer any of them. US$0.01182 is a sum of two model calls. “2 write call(s)” does not say which one was the second refund. And the wait is not in the totals at all.
A total is like a parcel that “took three days”. To fix anything, you need the step.
The idea: a waterfall
Section titled “The idea: a waterfall”A waterfall is the picture of one trace: one row per span, in time order. Each row has a bar on a shared time line. The bar starts when the span started, and its length is how long the span lasted. The name comes from the look: the bars step down and to the right, like water down a stair.
Five things in a waterfall need a name:
- The offset is when a span started, counted from the start of its trace.
2.4 smeans 2.4 seconds after the run began. - The duration is how long the span lasted. A long bar is a slow step.
- The indent shows the parent. A row that is moved to the right is a child of the row above it. The first row, with no parent, is the root span: here, the whole agent run.
- An error is a span with the status
ERROR. The detail after it says why, for exampletimeout. - A gap is time with no span. Nothing ran. In an agent run, a gap is often a wait: for a person, or for the next message.
Two more things are special to agent runs. A retry is the same tool called again, after an error. Its idempotency key tells you whether it is the same operation or a new one. And a link joins the second trace of a run to the first one, across a gap.

Text description of the diagram
Trace 1 has five rows. The first is the run span, 6.56 seconds, the agent’s whole work. Under it are two model calls of 2.39 and 4.17 seconds, with the order lookup between them, and then the request for approval. The second model call cost US$0.00703, the most of any step. Then comes a dashed box: 15 hours 25 minutes with no span, while the run waited for a person. Trace 2 starts with Sam’s approval, linked back to the approval request. Its first refund call is red: an error, a timeout after 10.00 seconds. The next row is the same refund with a new key, done. The last row is the reply, sent. Each trace has its own time axis.
Worked example: read R-1014-040 row by row
Section titled “Worked example: read R-1014-040 row by row”Print the whole waterfall of the double refund from the saved week:
python -m obs trace R-1014-040 --data data/telemetry/weekRun R-1014-040 | ticket T-90104 | chat-strong (agent_structured) | release 2.1.0 | language en2 model call(s), 1 read(s), 2 write call(s), 4586 tokens in, 265 out, US$0.01182
Trace 1 f0433c4403e2767e1d69ece18a947526 Wed 14 Oct 17:52:00 6.6 s 0.0 s |========================| 6.56 s invoke_agent support-resolver resolve rule W2 0.0 s |========= | 2.39 s chat chat-strong 2160 in / 47 out US$0.00479 stop 2.4 s | = | 0.00 s execute_tool get_order ok LK-793996 2.4 s | ================| 4.17 s chat chat-strong 2426 in / 218 out US$0.00703 stop 6.6 s | =| 0.00 s approval.request needs agent
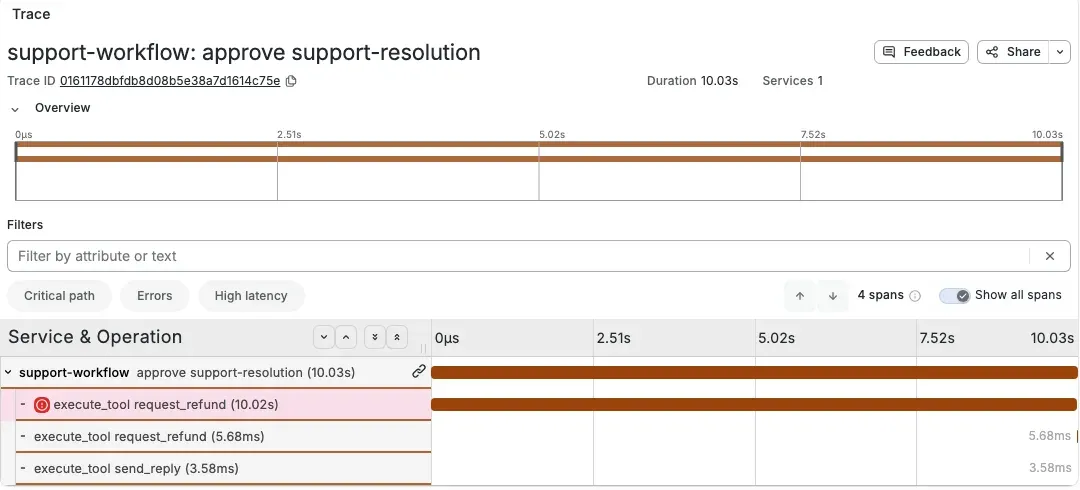
... waited 15 h 25 min for a person (this trace has a link to 78d246ee22e5f5ef in trace f0433c44...)Trace 2 15ba0d9388d1b9e001af373f21c4b955 Thu 15 Oct 09:17:12 10.0 s 0.0 s |========================| 10.01 s approve support-resolution approved by usr-sam (agent, limit 100) 0.0 s |========================| 10.00 s execute_tool request_refund ERROR timeout LK-793996 9.95 RFD-LATE key 797fbb5bbb9f8a7e 10.0 s | =| 0.00 s execute_tool request_refund done LK-793996 9.95 RFD-LATE key 797fbb5bbb9f8a7e-retry1 10.0 s | =| 0.00 s execute_tool send_reply sent
Outcome: resolvedRead it in four passes, as you read the tracking page.
Pass 1: the shape. There are two traces with a gap between them. Trace 1 ends with approval.request, so the run asked a person. Trace 2 starts with approve, so a person decided. In this workflow, a second trace always means a person’s decision.
Pass 2: the slow step. Look for the longest bar under the root. In trace 1, the second model call took 4.17 s of 6.56 s: 4.17 ÷ 6.56 = 64%. In trace 2, the first refund call took 10.00 s, and it is red. That is the slowest step of the whole run, and it is an error. The model spans last as long as the recorded calls did (Module 2’s run clock). The 10 seconds are the simulated payment service’s timeout.
Pass 3: the expensive step. Only model calls cost money here. Each cost is tokens × the price of chat-strong in the agents course’s price table. That is US$2.00 per million tokens in, and US$10.00 per million out.
| Model call | Tokens in × price | Tokens out × price | Cost |
|---|---|---|---|
| 1 | 2,160 × 2.00 ÷ 1,000,000 = 0.00432 | 47 × 10.00 ÷ 1,000,000 = 0.00047 | US$0.00479 |
| 2 | 2,426 × 2.00 ÷ 1,000,000 = 0.00485 | 218 × 10.00 ÷ 1,000,000 = 0.00218 | US$0.00703 |
The second call is the expensive step: 0.00703 ÷ 0.01182 = 59% of the run. It read more (the order details from get_order were added to the conversation) and it wrote more (the proposal and the draft reply). Output tokens cost five times as much as input tokens.
Pass 4: the gaps and the changes. The longest time in this run is not a bar. It is the gap: 15 h 25 min, from Wednesday 17:52 to Thursday 09:17. For the customer, this was the whole delay. A dashboard of span durations would never show it, because a gap is not a span. The workflow records the wait as an attribute instead (larkfield.approval.wait_s, from Module 3).
Then look for writes. Trace 2 has two request_refund rows. The first timed out. The second has a new key, 797fbb5bbb9f8a7e-retry1, and is done. Its parent is approve support-resolution, not a model call. So no model asked for the second refund. The workflow’s retry code sent it, with a new key, and the payment service made a second refund.
Now Sam has the answers. The slow step is the refund call that timed out. The expensive step is the second model call. The wait was 15 h 25 min for a person. And the step that caused the second refund is the retry, not the model.
Explore the waterfall
Section titled “Explore the waterfall”Explore
Read a run: the slow step, the expensive step and the wait
Predict first: In run R-1014-040, which step caused the second refund: a model call, a person, or another step? Write down the span name.
- Run
- R-1014-040 · ticket T-90104 · chat-strong · release 2.1.0
- Evidence
- replayed decision; simulated timeout and naive retry
- Outcome
- resolved
- Steps
- 2 model calls, 4 tool calls
- Tokens in / out · cost
- 4586 / 265 · US$0.01182
- Slowest step
- execute_tool request_refund, 10.00 s (at Thu 09:17:12)
- Most expensive step
- chat chat-strong, US$0.00703 (59% of the run)
- Wait for a person
- 15 h 25 min
- Flags (obs)
- duplicate_write
Choose a run, then open a row of the waterfall to read its attributes.
Open a row to read the span’s attributes.
Trace 1 · Wed 14 Oct 17:52:00 · 6.6 s
invoke_agent support-resolver resolve · rule W26.56 s
- gen_ai.request.model
- chat-strong
- gen_ai.usage.input_tokens
- 4586
- gen_ai.usage.output_tokens
- 265
- larkfield.cost.usd
- 0.011822
- larkfield.proposal.outcome
- resolve
- larkfield.proposal.rule
- W2
- larkfield.stop_reason
- finished
- larkfield.release
- 2.1.0
chat chat-strong 2160 in / 47 out · US$0.004792.39 s
- gen_ai.request.model
- chat-strong
- gen_ai.response.model
- gpt-6.1-sol-2026-09-29
- gen_ai.usage.input_tokens
- 2160
- gen_ai.usage.output_tokens
- 47
- gen_ai.response.finish_reasons
- stop
- larkfield.cost.usd
- 0.00479
- larkfield.model.requested
- get_order(order_id)
execute_tool get_order ok0.00 s
- gen_ai.tool.name
- get_order
- larkfield.tool.kind
- read
- larkfield.tool.status
- ok
- larkfield.order.id
- LK-793996
chat chat-strong 2426 in / 218 out · US$0.007034.17 s
- gen_ai.request.model
- chat-strong
- gen_ai.response.model
- gpt-6.1-sol-2026-09-29
- gen_ai.usage.input_tokens
- 2426
- gen_ai.usage.output_tokens
- 218
- gen_ai.response.finish_reasons
- stop
- larkfield.cost.usd
- 0.007032
- larkfield.model.requested
- finish(-)
approval.request needs agent0.00 s
- larkfield.approval.needs_role
- agent
- larkfield.approval.limit
- 100
waited 15 h 25 min for a person: a gap, not a span. Trace 2 starts with a link to approval.request in trace 1.
Trace 2 · Thu 15 Oct 09:17:12 · 10.0 s
approve support-resolution approved by usr-sam (agent)10.01 s
- larkfield.approval.approver
- usr-sam
- larkfield.approval.role
- agent
- larkfield.approval.limit
- 100
- larkfield.approval.wait_s
- 55505.4
- larkfield.outcome
- resolved
- larkfield.writes_done
- 1
- larkfield.release
- 2.1.0
execute_tool request_refund ERROR timeout · 9.95 RFD-LATE · key 797fbb5bbb9f8a7e10.00 s
- gen_ai.tool.name
- request_refund
- larkfield.tool.kind
- write
- larkfield.write.outcome
- timeout
- larkfield.idempotency_key
- 797fbb5bbb9f8a7e
- larkfield.operation.id
- 797fbb5bbb9f8a7e
- larkfield.order.id
- LK-793996
- larkfield.refund.amount
- 9.95
- larkfield.refund.reason
- RFD-LATE
- error.type
- timeout
execute_tool request_refund done · 9.95 RFD-LATE · key 797fbb5bbb9f8a7e-retry10.00 s
- gen_ai.tool.name
- request_refund
- larkfield.tool.kind
- write
- larkfield.write.outcome
- done
- larkfield.idempotency_key
- 797fbb5bbb9f8a7e-retry1
- larkfield.operation.id
- 797fbb5bbb9f8a7e
- larkfield.order.id
- LK-793996
- larkfield.refund.amount
- 9.95
- larkfield.refund.reason
- RFD-LATE
execute_tool send_reply sent0.01 s
- gen_ai.tool.name
- send_reply
- larkfield.tool.kind
- write
- larkfield.tool.status
- ok
- larkfield.reply.status
- sent
Each trace has its own time scale.
Text description of the explorer
Choose one of four runs of the saved week. The readout gives the run, how its evidence was made, and its outcome. It also gives the steps, the tokens and the cost, the slowest step, the most expensive step and the wait for a person. Below it is the waterfall, one row per span. Open a row to read its attributes. R-1014-040, the double refund: the slowest step is execute_tool request_refund, 10.00 s at Thu 09:17:12. The most expensive is chat chat-strong, US$0.00703, 59% of the run. The wait is 15 h 25 min. Its second request_refund row has the key 797fbb5bbb9f8a7e-retry1 and its parent is the approval, not a model call. R-1012-034, the same ticket on chat-small: one trace, 3.00 s, US$0.00055, no wait; it asked the customer. For R-1018-010, on the local model gemma3:4b, the readout shows 7 model calls in 19.7 s. Its slowest step is a model call of 6.22 s. It has an error on get_payments, and no cost, because the local model is priced at US$0 (an assumption). R-1018-022: the slowest step is a failed get_order call that timed out after 10.00 s.
Open the second request_refund row of R-1014-040 in the explorer. Its attributes show larkfield.write.outcome: done and the new key. Then open the first one: error.type: timeout. The answer to the prediction is in those two rows.
The same ticket, a cheaper run
Section titled “The same ticket, a cheaper run”On Monday, before Omar’s switch to chat-strong for hard tickets, the same ticket ran on chat-small. Read it:
python -m obs trace R-1012-034 --data data/telemetry/weekRun R-1012-034 | ticket T-90104 | chat-small (agent) | release 2.0.0 | language en2 model call(s), 1 read(s), 0 write call(s), 4565 tokens in, 179 out, US$0.00055
Trace 1 3a6cd2cce257c77ab2a0ae8dd9d5841d Mon 12 Oct 15:31:37 3.0 s 0.0 s |========================| 3.00 s invoke_agent support-resolver ask_customer rule W3 0.0 s |======== | 1.05 s chat chat-small 2163 in / 21 out US$0.00023 tool_calls 1.1 s | = | 0.01 s execute_tool get_order ok LK-793996 1.1 s | ================| 1.95 s chat chat-small 2402 in / 158 out US$0.00032 tool_calls 3.0 s | =| 0.00 s execute_tool send_reply sent
Outcome: asked_customerThe shape is almost the same: two model calls with one lookup between them. But there is one trace, not two. The model chose rule W3 and asked the customer a question, so no approval and no write were needed. The run cost US$0.00055, about 22 times less than R-1014-040.
Is cheaper better here? No. By the course’s labels, this ticket needed a refund (rule W2), and chat-small asked the customer instead. The waterfall shows what the run did and what it cost. It does not show whether the decision was right. That needs a review or a label, as Module 7 shows.
Larkfield’s local model: slow, and “free”
Section titled “Larkfield’s local model: slow, and “free””On the weekend, Tomás sent 30% of tickets to the local model gemma3:4b. Read one of its runs:
python -m obs trace R-1018-010 --data data/telemetry/weekRun R-1018-010 | ticket T-90602 | gemma3:4b (agent_structured) | release 2.1.1 | language en7 model call(s), 3 read(s), 0 write call(s), 17582 tokens in, 542 out, US$0.00000
Trace 1 bf5b941801388658eaa36cf0bba32133 Sun 18 Oct 11:15:00 19.7 s 0.0 s |========================| 19.72 s invoke_agent support-resolver reply_only rule double charge 0.0 s |== | 1.68 s chat gemma3:4b 1898 in / 45 out US$0.00000 stop 1.7 s | = | 0.00 s execute_tool get_order ok LK-645112 1.7 s | == | 1.99 s chat gemma3:4b 2231 in / 41 out US$0.00000 stop 3.7 s | = | 0.20 s execute_tool get_payments ERROR service_unavailable LK-645112 3.9 s | === | 1.50 s chat gemma3:4b 2322 in / 42 out US$0.00000 stop 5.4 s | === | 1.69 s chat gemma3:4b 2412 in / 47 out US$0.00000 stop 7.1 s | = | 0.00 s execute_tool search_policy ok 7.1 s | === | 2.08 s chat gemma3:4b 2768 in / 42 out US$0.00000 stop 9.1 s | ======== | 6.22 s chat gemma3:4b 2858 in / 195 out US$0.00000 stop 15.4 s | ======| 4.36 s chat gemma3:4b 3093 in / 130 out US$0.00000 stop 19.7 s | =| 0.00 s execute_tool send_reply sent
Outcome: resolvedThis run has seven model calls in 19.7 s. The slowest step is a model call of 6.22 s. The cost is US$0 in every row, because the course prices the local model at zero. That is an assumption: the computer, its power and its memory are not counted. So for this run, “the expensive step” can only mean time. With a price of zero, a cost panel would call the slowest model the cheapest one.
There is also a red row: get_payments failed with service_unavailable at 3.7 s, and no later get_payments call worked. Yet the run ended with a reply and the outcome resolved. Keep this row in mind. In the third lesson of this module, it has a name.
Read a run in Grafana
Section titled “Read a run in Grafana”This part is optional, and it needs Docker. Grafana shows only what the workflow sends to it, so first send it a week. The week driver of The Collector replays the 316 runs with your project’s code, through the Collector in Grafana’s container:
- Start Grafana from the project folder:
docker compose -f grafana/compose.yaml up -d. The first start also downloads the image: about 0.9 GB, 3.5 GB on disk. On the course team’s laptop, the stack was then ready in 4 to 52 seconds, the longest when the laptop was busy. - Send the week:
python -m scenarios week --otlp --out work/week. It replays the week at 1,000 times speed, so one practice day lasts about 86 seconds. On the course team’s laptop, it took 638 to 639 seconds in two runs. - Open Grafana at
http://localhost:3031. - When you no longer need it, stop it and delete its data:
docker compose -f grafana/compose.yaml down -v.
The same waterfall is in Grafana’s trace view. Open Explore, choose the data source Tempo and the query type TraceQL, and search for every trace of the ticket:
{ span.larkfield.ticket.id = "T-90104" }Click a trace ID to open its waterfall. Grafana draws the same rows, bars and indents, and an overview line above them. It marks an error span with a red icon. Its filter buttons Errors and High latency do passes 2 and 4 for you: they keep only the red rows, or only the long ones. Grafana shows one trace at a time, so you follow the link from trace 2 to trace 1 yourself. Your times differ from the saved week’s: each replay has its own run clock.
Guided practice: read your own run
Section titled “Guided practice: read your own run”Now make the double refund yourself, and read its waterfall before and after the approval.
-
Run the ticket the way release 2.1.0 ran it:
Terminal window python -m resolver run T-90104 --variant agent_structured --model chat-strongThe last line:
Nothing has changed yet. Next: python -m resolver approve T-90104-agent_structured-chat-strong-1 --as agent (or: reject) -
Read your run’s waterfall now, while it waits:
Terminal window python -m obs trace T-90104Run T-90104-agent_structured-chat-strong-1 | ticket T-90104 | chat-strong (agent_structured) | release 2.0.0 | language en2 model call(s), 1 read(s), 0 write call(s), 4586 tokens in, 265 out, US$0.00000Trace 1 … 6.6 s0.0 s |========================| 6.56 s invoke_agent support-resolver resolve rule W20.0 s |========= | 2.39 s chat chat-strong 2160 in / 47 out - stop2.4 s | = | 0.00 s execute_tool get_order ok LK-7939962.4 s | ================| 4.17 s chat chat-strong 2426 in / 218 out - stop6.6 s | =| 0.00 s approval.request needs agentOutcome: waiting_approvalOne trace, and the outcome
waiting_approval. Your trace ID and time differ. The cost shows-: your spans have no cost yet, because cost on spans arrives in Module 5. The saved week was recorded with it. The release says2.0.0, the default ofOBS_RELEASE. -
Approve it as Sam, with the slow payment service and the naive retry:
Terminal window python -m resolver approve T-90104-agent_structured-chat-strong-1 --as agent --name Sam --fault request_refund:timeout_after_write --naive-retryrequest_refund LK-793996: done (operation 797fbb5bbb9f8a7e, 2 call(s))Status: doneReply sent. Ticket: resolved. -
Read the waterfall again:
Terminal window python -m obs trace T-90104The end of the output:
... waited 0 min 00 s for a person (this trace has a link to … in trace …)Trace 2 … 10.0 s0.0 s |========================| 10.00 s approve support-resolution approved by usr-sam (agent, limit 100)0.0 s |========================| 10.00 s execute_tool request_refund ERROR timeout LK-793996 9.95 RFD-LATE key 797fbb5bbb9f8a7e10.0 s | =| 0.00 s execute_tool request_refund done LK-793996 9.95 RFD-LATE key 797fbb5bbb9f8a7e-retry110.0 s | =| 0.00 s execute_tool send_reply sentOutcome: resolved -
Do the four passes on your own output, and check five things. The shape is two traces. The slow step is the refund that timed out. The expensive step is the second model call (2,426 tokens in, 218 out). The gap is about zero, because you approved at once. And the second refund has the key ending in
-retry1.
The steps are the same as the saved week’s, because the model decisions are the same recordings. Only the clock and the wait differ.
Common mistake
The waterfall has only one trace, and no refund
Symptom: python -m obs trace T-90104 shows trace 1 only, with Outcome: waiting_approval. There is no request_refund row, so you cannot find the second refund.
Cause: the run is still waiting for a person. Trace 2 does not exist until somebody approves or rejects the proposal. This is the waterfall of a run that has not finished.
Diagnose: look at the last row and the outcome. approval.request as the last row, and waiting_approval, mean “waiting”.
Recover: approve the run (step 3 above), then read the trace again. In real use, a run can wait for hours, as R-1014-040 did. Do not read a waiting run as a failed run.
Common mistake
A long bar in trace 2 looks shorter than a short bar in trace 1
Symptom: in a picture of a run with two traces, a 10-second bar looks no longer than a 6-second bar.
Cause: each trace has its own time scale. obs, Grafana and the explorer all scale a bar to its own trace. A shared scale would put 15 hours of gap between the traces, and every bar would be too thin to see.
Recover: compare durations by their numbers, not by their bars, across traces. Compare bars only inside one trace.
Your turn: find the slow step of another run
Section titled “Your turn: find the slow step of another run”Change one condition: a run where a tool call, not a model call, is the slow step.
-
Predict: run R-1018-022 is gemma3:4b on ticket T-90601, on Sunday evening. Its root span lasted 22.5 s. Will the slowest step be a model call or a tool call? How much of the 22.5 s will it take?
-
Read it:
Terminal window python -m obs trace R-1018-022 --data data/telemetry/week -
Do the four passes, and compare with your prediction.
Check your prediction
The course’s output (replayed decisions, a simulated order-service timeout):
Trace 1 cec6ea30d7d9124ef43d05a927af8e14  Sun 18 Oct 17:00:31  22.5 s     0.0 s |========================|  22.51 s  invoke_agent support-resolver  reply_only  rule W1     0.0 s |==                      |   1.70 s    chat gemma3:4b  1894 in / 45 out  US$0.00000  stop     1.7 s | ===========            |  10.00 s    execute_tool get_order  ERROR service_timeout  LK-645001    11.7 s |            =======     |   6.43 s    chat gemma3:4b  1986 in / 202 out  US$0.00000  stop    18.1 s |                   =    |   0.00 s    execute_tool get_customer_orders  ok    18.1 s |                   =====|   4.38 s    chat gemma3:4b  2253 in / 130 out  US$0.00000  stop    22.5 s |                       =|   0.00 s    execute_tool send_reply  sent
Outcome: resolved
The slowest step is a tool call: get_order waited 10.00 s and then failed with service_timeout. That is 10.00 ÷ 22.51 = 44% of the run. The model then looked up the customer’s orders instead, and replied. There is one trace and no gap, because the reply needed no approval. The cost is US$0 (the local model’s assumed price). So in this run, the slow step is an error, and nothing in the final outcome says so.
When to read a waterfall, and what it costs
Section titled “When to read a waterfall, and what it costs”Read a waterfall when you have one run and a question about it. Why was it slow? Why did it cost what it did? Why did it change what it changed? It is the most detailed record you have of a run’s path.
It is the wrong tool for a whole week. One careful read takes a few minutes, and the saved week has 316 runs in 434 traces. A waterfall also cannot tell you whether a decision was right. And it does not show the model’s words, because content capture is off. And a trace may be missing: the Collector’s tail sampling keeps some traces only. The next lesson searches many runs at once.
Knowledge check
Section titled “Knowledge check”Check your understanding
In the waterfall of R-1014-040, which row is the slow step, which is the expensive step, and where is the customer's long wait? Give the number for each.
Show the answer
The slow step is the first execute_tool request_refund row in trace 2: 10.00 s, an error (timeout). The expensive step is the second chat chat-strong row in trace 1: US$0.00703 of US$0.01182, 59%. It had 2,426 tokens in and 218 out. The customer’s long wait is not a row. It is the gap of 15 h 25 min between the two traces, while the run waited for a person.
Does your answer have the main points of ours?
Sign in and enroll in the course to save your answers. Every check counts toward the certificate.
Check your understanding
Which span caused the second refund of R-1014-040, and how do you know that no model asked for it?
Show the answer
The second execute_tool request_refund span in trace 2, with the key 797fbb5bbb9f8a7e-retry1 and the outcome done. Its parent is approve support-resolution, the person’s decision, and it starts right after the first refund call timed out. No chat span comes between them. So the workflow’s retry code sent it, not the model. Its new key made the payment service treat it as a new refund.
Does your answer have the main points of ours?
Sign in and enroll in the course to save your answers. Every check counts toward the certificate.
Check your understanding
Run R-1018-010 cost US$0.00000. Why can you not call it the cheapest run of the weekend?
Show the answer
Its cost is zero only because the course prices the local model gemma3:4b at US$0, an assumption. The hardware, power and memory are not counted. By time, it was one of the slowest runs: seven model calls in 19.7 s. Without a real price for the local model, the cost of a run on it says nothing.
Does your answer have the main points of ours?
Sign in and enroll in the course to save your answers. Every check counts toward the certificate.
Recap
- A waterfall is one row per span, in time order. Read the offset, the duration, the indent (the parent), errors and gaps.
- Read in four passes: the shape (one trace or two), the slow step, the expensive step, then the gaps and the writes.
- In R-1014-040, the slow step is the refund that timed out (10.00 s). The expensive step is the second model call (US$0.00703, 59%). The wait is a gap of 15 h 25 min. The retry with a new key, not the model, caused the second refund.
- The local model’s cost is zero by assumption, so its “expensive step” can only be measured in time.
Your project is unchanged: the same as the snapshot end-of-m03. You can now read one run and find its slow step, its expensive step and its changes. But the saved week has 316 runs, and you cannot open them one by one. Next, you search runs by their structure with TraceQL. You look for many calls to one tool, a write without an approval, and an error followed by a resolved outcome.
Next: Search runs with TraceQL