
Send the same traces to Langfuse
- Lesson 26
- 40 min
- Module 8: Tools: Langfuse, others and the run inspector
Where we are
In Module 7, we turned the telemetry into service levels, alerts and a quality loop, all in Grafana. Grafana sees the whole system, but it does not know what a session, a model generation or a review score is. In this lesson, we add a second exporter to the Collector, send the same redacted traces to Langfuse, and compare the two views of one run. We start with a contract that two offices need.
Lesson 26 of 28 · Observability for AI Agents: Traces, Costs and Audit TrailsSend the same traces to Langfuse
1. Why agents need their own observability
2. OpenTelemetry for agents
3. Instrument the workflow
4. Find agent failures in Grafana
5. Cost
6. Audit trails
7. Alerts, service levels and quality
8. Tools: Langfuse, others and the run inspector
What you will be able to do
Send the same redacted traces to a second tool, Langfuse, without changing one line of the application. Then read one run there and say what each tool shows better.
Before you startWhat to know and to have ready
What you need to know
- The Collector, its pipelines and its redaction, from The Collector.
- A run as two linked traces, from Approvals, people and waiting time.
- The sampled reviews, from Quality from live runs.
What you need on your computer
- Your project as the last module left it: the snapshot
end-of-m07, wherepython -m pytest -qends with112 passed, 1 skipped, 1 deselected. - The virtual environment active, and a terminal in the project folder,
observable-workflow.
Optional: a Langfuse account and Docker. Sending traces to Langfuse needs your own free Langfuse account (the Hobby plan, no payment) and Grafana in Docker. Send only the course’s practice data: it is synthetic. If you do not want an account, follow the offline path: the course team’s recorded answers from Langfuse are on this page.
Tested on macOS (Apple silicon) with Python 3.12.13 and the Collector 0.162.0. The Windows (PowerShell) and Linux commands are written, not run. The course team sent the replayed week to Langfuse once; your numbers come from your own run and will differ in the IDs.
One contract, two offices
Section titled “One contract, two offices”A company signs a contract. The accountant needs a copy, and so does the lawyer. You do not write the contract twice. You make two copies of the same paper. Before the copies leave your office, you black out the bank account number, because neither office needs it.
Each office files its copy in its own way: the accountant by month, the lawyer by client. Each one finds different answers quickly.
The problem: one tool cannot answer every question fast
Section titled “The problem: one tool cannot answer every question fast”Priya owns quality. In Module 7, she put the sampled reviews on the runs as gen_ai.evaluation.result events. Now she asks: “Show me the model calls of every run that failed its review, with their tokens.”
In Grafana, that is possible but slow. The review is an event in Loki, the model calls are spans in Tempo, and a run is two traces joined by a link. Grafana is good at “what is wrong in the system now”. It has no idea of a “session”, a “generation” or a “score”.
Tools built for model applications, such as Langfuse, file the same data in Priya’s way. They group the traces of one run, show each model call with its tokens, and keep scores next to the run. But a second tool brings a second risk. Every new destination is a new place where a prompt, an email address or a card number can leak.
The idea: a second exporter in the same Collector
Section titled “The idea: a second exporter in the same Collector”The application already sends all its telemetry to one address, the Collector. The Collector decides where data goes. So to add a tool, you add one exporter and one pipeline. An exporter is the part of the Collector that sends data to one destination. A pipeline is the path that data takes from a receiver to an exporter. This is called fan-out: one input, several outputs.
The application does not change. The new pipeline reuses the same redaction processor. So the copy for Langfuse is blacked out before it leaves, like the contract.
A tiny example: what the change adds
Section titled “A tiny example: what the change adds”The course’s project has a second Collector configuration for this, collector/otelcol-config-langfuse.yaml. Compare it with the one you already have:
diff collector/otelcol-config.yaml ../nextia-learning-labs/C31/snapshots/end-of-m08/collector/otelcol-config-langfuse.yaml22a27,30> basicauth/langfuse:> client_auth:> username: ${env:LANGFUSE_PUBLIC_KEY}> password: ${env:LANGFUSE_SECRET_KEY}95a104,109> otlp_http/langfuse:> endpoint: ${env:LANGFUSE_BASE_URL}/api/public/otel> headers:> x-langfuse-ingestion-version: "4" # Langfuse's docs: new data appears in real time> auth:> authenticator: basicauth/langfuse114c128< extensions: [health_check]---> extensions: [health_check, basicauth/langfuse]119a134,137> traces/langfuse: # the same traces, not sampled: Langfuse's free plan counts units, check them> receivers: [otlp]> processors: [memory_limiter, transform/redact, batch]> exporters: [otlp_http/langfuse]The diff also adds four comment lines at the top, not shown here. Read the four parts that change:
- An extension,
basicauth/langfuse. It signs each request with your project’s two keys. The keys come from environment variables, so they are never in a file that you commit. - An exporter,
otlp_http/langfuse. It sends OTLP over HTTP to Langfuse’s OpenTelemetry address,/api/public/otel. Langfuse accepts HTTP only, not gRPC. The headerx-langfuse-ingestion-version: "4"asks for Langfuse’s newer ingestion: without it, its documentation says new data can be delayed by up to 10 minutes. - The extension is switched on in the service.
- A new pipeline,
traces/langfuse. It has the same receiver and the sametransform/redactprocessor as the Grafana pipeline. It has notail_sampling: Langfuse gets every trace.
Why no sampling for Langfuse? Priya’s reviews hit 20% of the runs at random. A review on a run that sampling dropped would point at nothing. The cost of that choice is volume, and Langfuse’s plans count volume, as you see below.
One Collector, three destinations
Section titled “One Collector, three destinations”
Text description of the diagram
The workflow knows one address only. In the Collector, the traces pass the redaction once, and then split. One copy goes through tail sampling to Tempo, and the other copy goes to Langfuse unsampled. Events go to the routing connector: audit events go to the audit store only, never to Loki or Langfuse. Metrics go to Prometheus. Langfuse is the only destination outside your computer, so it is the only one that needs keys.
What would leave your computer
Section titled “What would leave your computer”Before the course team sent anything to Langfuse, they checked what leaves. They ran the Langfuse configuration with the Collector 0.162.0. They pointed it at a small stand-in, a local program that answers like Langfuse and keeps what it receives. They turned content capture on (OBS_CAPTURE_CONTENT=on), so that the application put the prompt text on the model spans. Then they replayed the double refund and sent one constructed span with a made-up email address and a test card number.
Here is what the stand-in received, from the course team’s run:
| What | Value |
|---|---|
| Requests | 3, all to /api/public/otel/v1/traces |
| Format | application/x-protobuf, gzip |
| Headers | authorization (Basic, with the two keys), x-langfuse-ingestion-version: 4 |
| Spans of the run | 9 in 2 traces, every one with session.id = the run’s ID |
Prompt text (gen_ai.input.messages) |
none (the app’s own export had it on both model spans: 7,823 and 8,817 characters) |
| The constructed span | Write to [email], card [card number] |
So the redaction runs before the copy leaves. The application recorded more than 16,000 characters of prompt text, and none of it reached the stand-in. The failure case at the end of this lesson comes from the same check, with wrong keys.
A session is one run
Section titled “A session is one run”Langfuse has a word that Grafana does not have: a session, a group of traces that belong together, like the turns of one chat. Our run has two traces: the agent’s work, and the person’s decision with the writes. Module 3 joined them with a span link. Langfuse groups traces by the attribute session.id, so the project now puts the run’s ID on every span as session.id.
The change is small: a span processor in resolver/telemetry.py. A span processor is code that the OpenTelemetry SDK calls when each span starts and ends. This one, SessionProcessor, adds session.id at the start of every span of a run.
Here is the tiny example before the change. Run one ticket and read the attribute:
python -m resolver run T-80008python -c "from obs.model import Telemetry; r = next(iter(Telemetry('work/telemetry').runs.values())); print(r.run_id, {s.get('session.id') for s in r.spans})"T-80008-agent-chat-small-1 {None}No span has the attribute yet.
Add Langfuse to your project
Section titled “Add Langfuse to your project”-
Copy this module’s files from the snapshot
end-of-m08:Terminal window S=../nextia-learning-labs/C31/snapshots/end-of-m08cp $S/collector/otelcol-config-langfuse.yaml collector/cp $S/resolver/telemetry.py resolver/cp $S/tests/test_stage_m08.py tests/cp $S/README.md .Terminal window $S = "..\nextia-learning-labs\C31\snapshots\end-of-m08"Copy-Item -Force $S\collector\otelcol-config-langfuse.yaml collector\Copy-Item -Force $S\resolver\telemetry.py resolver\Copy-Item -Force $S\tests\test_stage_m08.py tests\Copy-Item -Force $S\README.md .Terminal window S=../nextia-learning-labs/C31/snapshots/end-of-m08cp $S/collector/otelcol-config-langfuse.yaml collector/cp $S/resolver/telemetry.py resolver/cp $S/tests/test_stage_m08.py tests/cp $S/README.md . -
Run the tests:
python -m pytest -q. The last line says114 passed, 1 skipped, 1 deselected. Your project is now the snapshotend-of-m08, the course’s finished project. One new test checks that the configuration has no key in it. The other runs a ticket and checks that every span has the run’s ID assession.id. -
Delete the folder
work. In PowerShell, useRemove-Item -Recurse work. -
Replay the double refund, the agent’s part first:
Terminal window python -m resolver run T-90104 --variant agent_structured --model chat-strong -
Approve it with the timeout and the naive retry of Module 3:
Terminal window python -m resolver approve T-90104-agent_structured-chat-strong-1 --as agent --fault request_refund:timeout_after_write --naive-retryThe last line says
Reply sent. Ticket: resolved. -
Read the trace ID, the name and
session.idof every span:Terminal window python -c "from obs.model import Telemetry; r = next(iter(Telemetry('work/telemetry').runs.values())); print(r.run_id, len(r.trace_ids), 'traces'); [print(s.trace_id[:8], s.name, s.get('session.id')) for s in r.spans]"T-90104-agent_structured-chat-strong-1 2 tracese6059f6b invoke_agent support-resolver T-90104-agent_structured-chat-strong-1e6059f6b chat chat-strong T-90104-agent_structured-chat-strong-1e6059f6b execute_tool get_order T-90104-agent_structured-chat-strong-1e6059f6b chat chat-strong T-90104-agent_structured-chat-strong-10cb7e8f2 approve support-resolution T-90104-agent_structured-chat-strong-10cb7e8f2 execute_tool request_refund T-90104-agent_structured-chat-strong-1e6059f6b approval.request T-90104-agent_structured-chat-strong-10cb7e8f2 execute_tool request_refund T-90104-agent_structured-chat-strong-10cb7e8f2 execute_tool send_reply T-90104-agent_structured-chat-strong-1Your trace IDs are different: they are random. Two traces, nine spans, one
session.id.
Send the replayed week to Langfuse (optional)
Section titled “Send the replayed week to Langfuse (optional)”This part needs your own Langfuse account and Docker. It replays the week in about 10 minutes and sends it to Grafana and to Langfuse at the same time. Warning: send only the course’s practice data. Never point this configuration at a real workflow until your own team has checked its redaction.
-
Sign up for Langfuse Cloud on the free Hobby plan, and create a project. Choose its region: EU (
https://cloud.langfuse.com), US (https://us.cloud.langfuse.com) or Japan (https://jp.cloud.langfuse.com). -
In the project’s settings, create an API key pair. The public key starts with
pk-lf-, the secret key withsk-lf-. Keep the secret key out of every file. -
In the terminal where you will start Grafana, set the three variables. Use your region’s address and your keys:
Terminal window export LANGFUSE_BASE_URL=https://cloud.langfuse.comexport LANGFUSE_PUBLIC_KEY=pk-lf-...read -rs LANGFUSE_SECRET_KEY && export LANGFUSE_SECRET_KEYTerminal window $env:LANGFUSE_BASE_URL = "https://cloud.langfuse.com"$env:LANGFUSE_PUBLIC_KEY = "pk-lf-..."$env:LANGFUSE_SECRET_KEY = Read-Host -MaskInput "Secret key"Terminal window export LANGFUSE_BASE_URL=https://cloud.langfuse.comexport LANGFUSE_PUBLIC_KEY=pk-lf-...read -rs LANGFUSE_SECRET_KEY && export LANGFUSE_SECRET_KEYThe
read -rsline waits for you to paste the secret key, and does not show it. So the key is not in your shell’s history. -
In a second terminal, start the audit store’s door so that the container can reach it:
python -m auditstore serve --host 0.0.0.0. -
In the first terminal, start Grafana with the Langfuse configuration:
Terminal window OTELCOL_CONFIG=otelcol-config-langfuse.yaml docker compose -f grafana/compose.yaml up -dTerminal window $env:OTELCOL_CONFIG = "otelcol-config-langfuse.yaml"docker compose -f grafana/compose.yaml up -dTerminal window OTELCOL_CONFIG=otelcol-config-langfuse.yaml docker compose -f grafana/compose.yaml up -d -
Replay the week through the Collector:
python -m scenarios week --otlp --out work/week. It takes about 10 minutes. -
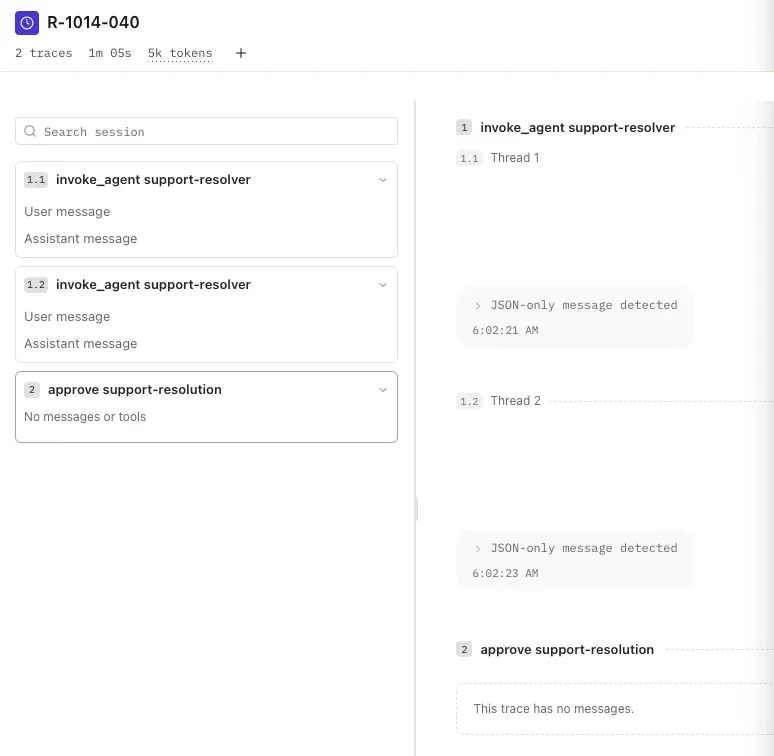
In Langfuse, open the project’s sessions and find
R-1014-040. The run IDs are seeded, so they are the same as in the saved week. -
When you are done, stop Grafana and delete its data:
docker compose -f grafana/compose.yaml down -v. Stop the audit store with Ctrl+C.
What Langfuse received
Section titled “What Langfuse received”The course team made this run once, with the replayed week at 1,000 times its real speed. Then they read Langfuse’s answers with its public API. Langfuse received all 2,027 spans as 2,027 observations, its word for a span, in 434 traces and 316 sessions: one session per run. 118 sessions hold two traces, the runs that waited for a person.
Text description of the chart
Four bars. TOOL: 750 observations, the execute_tool spans. GENERATION: 718, the chat spans, the model calls. AGENT: 316, one invoke_agent span per run. SPAN: 243, the approval spans and other spans that have no GenAI type. Langfuse names a tool observation without the execute_tool prefix, for example get_order.
Langfuse read the GenAI names of Module 2: chat became a generation and execute_tool a tool call, with no Langfuse code in the application. Because we followed the conventions, a second tool understood our data on the first day.
One run, read from Langfuse’s answer
Section titled “One run, read from Langfuse’s answer”Here is the double refund’s session, from Langfuse’s answer. One line per observation, shortened by the course team:
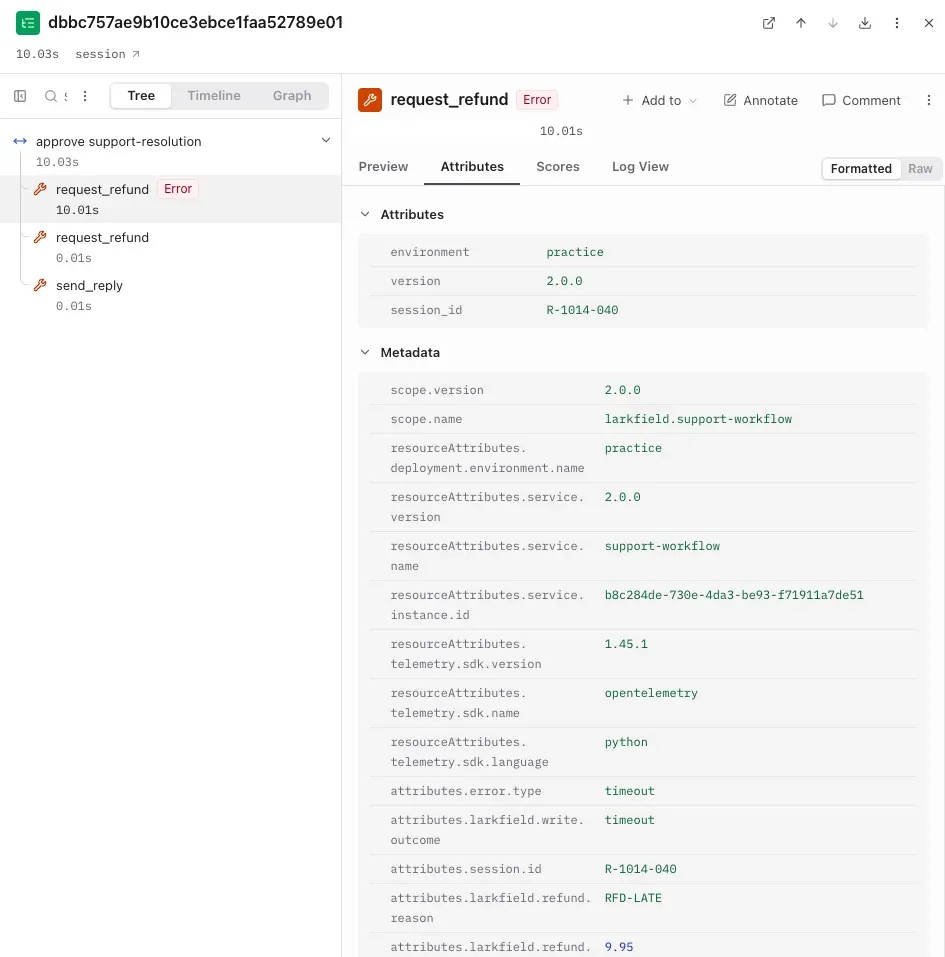
trace 2939c009 AGENT invoke_agent support-resolver latency 6.589 strace 2939c009 GENERATION chat chat-strong input 2160, output 47, totalCost nulltrace 2939c009 TOOL get_order DEFAULTtrace 2939c009 GENERATION chat chat-strong input 2426, output 218, totalCost nulltrace 2939c009 SPAN approval.requesttrace dbbc757a SPAN approve support-resolution latency 10.027 strace dbbc757a TOOL request_refund ERROR "timeout" key 797fbb5bbb9f8a7etrace dbbc757a TOOL request_refund DEFAULT key 797fbb5bbb9f8a7e-retry1trace dbbc757a TOOL send_reply DEFAULTscore: sampled-review = 0 (source API)The trace IDs are not the saved week’s: the course team ran the week again for Grafana and Langfuse. Read it from top to bottom:
- One session, two traces. Langfuse put the agent’s trace and Sam’s trace together because both have
session.id = R-1014-040. In Grafana, you followed a span link. - Tokens on each generation. Langfuse took them from
gen_ai.usage.input_tokensandgen_ai.usage.output_tokens. - The error on the first refund.
ERRORwith the messagetimeout, from the span’s status. The retry with the new key isDEFAULT, Langfuse’s level for an ordinary step. Every attribute of ours, such aslarkfield.idempotency_key, is kept as metadata. - A score. In the course team’s run, each of the week’s 60 sampled reviews was sent as a Langfuse score named
sampled-review, with the API. The double refund’s review is 0: a failed review.
Two surprises
Section titled “Two surprises”Langfuse computed no cost. Every generation came back with totalCost null. Langfuse infers a cost only when the model name matches one of its price definitions, and it does not know chat-small or gpt-6-luna. Our larkfield.cost.usd arrived, but only as metadata. So a second tool needs its own price definitions, or you send the cost in the attribute names it reads. Our dated price table from Module 5 stays the reference.
The read API had changed. The course team’s first reads, GET /api/public/traces and /sessions, answered HTTP 410 Gone: this project was on Langfuse’s newer version. The answers above come from the newer endpoints, GET /api/public/v2/observations and GET /api/public/v3/scores. Langfuse’s documentation lists the old endpoints as being retired. So a script that reads a tool’s API needs a test, as the Collector configuration does.
What it cost
Section titled “What it cost”Langfuse’s plans count units: each trace, observation and score is one. The run used about 2,521 units: 434 traces, 2,027 observations and 60 scores. The free Hobby plan allows 50,000 units a month, 30 days of data access and 2 users. Plans change: check Langfuse’s current pricing page before you plan on these limits. The next lesson compares this with other tools.
The same run in Grafana and in Langfuse
Section titled “The same run in Grafana and in Langfuse”Grafana draws the same run as two traces. Here is the second trace of the double refund in Grafana’s Explore, from the course team’s Grafana run of the same week:
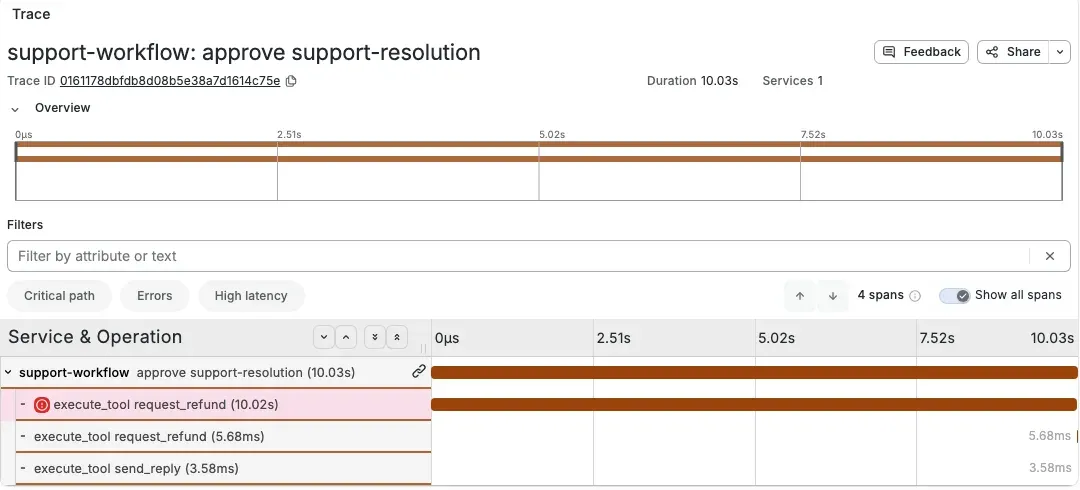
Put the two side by side:
| Question | Grafana | Langfuse |
|---|---|---|
| Is something wrong now? | Alerts, metrics and dashboards | Not used for alerts in this course |
| Find runs by a pattern | TraceQL over every span | Filters on observations |
| One run from start to end | Two traces, joined by a span link | One session, two traces |
| A model call | A span with attributes | A generation with tokens |
| Cost | Our metric larkfield.run.cost |
None: no price for our models |
| Reviews | Events in Loki | Scores next to the run |
| Every trace? | No: tail sampling kept 275 of 434 | Yes, every trace |
Neither tool is “better”. Grafana is the place for the whole system and its alerts; Langfuse is faster for Priya’s question. Both read the same data, because the application records once.
When to add a second destination, and what it costs
Section titled “When to add a second destination, and what it costs”Add one when a team’s questions are slow in the tool you have, as Priya’s are. Do not add one because it is easy: each destination is another place to secure, another bill and another retention period to know. Here, Langfuse’s free plan gives 30 days of data access, and Tempo keeps traces 14 days by default. The audit store keeps its records 7 years, an assumption for Larkfield.
The cost is small in code and real in operations: one exporter, one pipeline, two secret keys, and a plan to watch. Keep redaction in the Collector, before every exporter, so a new destination can never skip it.
Common mistake
Nothing arrives in Langfuse, and Grafana works
Symptom: Grafana shows the week, but Langfuse shows no new traces.
Cause: the Langfuse exporter fails, and the Collector drops the data. The other pipelines do not notice. The usual causes are a missing variable, the wrong keys, or a key pair from another region.
Diagnose: read the Collector’s log: docker compose -f grafana/compose.yaml logs lgtm | grep langfuse. In the course team’s checks, a missing LANGFUSE_BASE_URL gave a warning at start, then an error on export:
warn Configuration references unset environment variable {"name": "LANGFUSE_BASE_URL"}error Exporting failed. Dropping data. … "otlp_http/langfuse" … Post "/api/public/otel/v1/traces": unsupported protocol scheme ""Wrong keys gave this error (from the stand-in, which answered like a server that refuses the keys):
error Exporting failed. Dropping data. … "otlp_http/langfuse" … responded with HTTP Status Code 401Recover: set the three variables in the same terminal as docker compose, with the address of your project’s region. Then start the stack again: docker compose -f grafana/compose.yaml down and up -d. A 401 is permanent for the Collector: it does not retry, so the dropped traces are lost. Replay them, or accept the gap.
Your turn: send a second run and find it
Section titled “Your turn: send a second run and find it”- Replay the safe retry of Module 3: delete
work, run T-90104 again, then approve it with--fault request_refund:timeout_after_writeand without--naive-retry. - Predict: how many traces, how many spans, and how many different
session.idvalues does the run have? Check with the command of step 6. - Predict the number of observations in the session
R-1014-051, the week’s second double refund. Count its spans in the saved week withpython -m obs trace R-1014-051 --data data/telemetry/week. If you sent the week to Langfuse, open the session and check.
The answer is in the second knowledge check.
Knowledge check
Section titled “Knowledge check”Check your understanding
Tomás proposes to send the traces to Langfuse straight from the application, with Langfuse's own exporter, 'so that we skip the Collector'. What does the team lose?
Show the answer
The Collector’s redaction. Today the application sends to one address, and the Collector removes text and personal data before every exporter. A second path from the application would send data that no redaction has touched. With content capture on, that was more than 16,000 characters of prompt text for one run. The team also loses the one place that decides where data goes. Each new tool would then need a change and a release of the application. With the Collector, adding Langfuse took one exporter, one pipeline and two keys, and the application did not change.
Does your answer have the main points of ours?
Sign in and enroll in the course to save your answers. Every check counts toward the certificate.
Check your understanding
Your turn: the safe retry of T-90104. How many traces, spans and session.id values, and what changes in Langfuse?
Show the answer
Two traces and nine spans, with one session.id value, the run’s ID, on every span. Trace 1 has the same five spans as before. Trace 2 has approve support-resolution, one execute_tool request_refund (the timeout), execute_tool send_reply and reconcile request_refund: the reconcile asked the payment service and found that the refund happened, so no second refund call followed. In Langfuse, this run would be one session of nine observations, with one refund. R-1014-051 has 10 spans in the saved week, so 10 observations: Langfuse received every span. Its trace 2 has three refund calls (unavailable, timeout, then done with the key ending -retry2).
Does your answer have the main points of ours?
Sign in and enroll in the course to save your answers. Every check counts toward the certificate.
Check your understanding
In the course team's run, Langfuse showed no cost for any generation. Name the cause and two fixes, and say which number stays the reference.
Show the answer
Langfuse infers cost by matching the model name to its price definitions. It has none for chat-small, chat-strong or the deployment names behind them, so totalCost is null. Our larkfield.cost.usd arrived only as metadata. Fix 1: add price definitions for our models in Langfuse. Fix 2: send the cost in the attribute names that Langfuse reads as an ingested cost. Either way, the reference stays our own dated price table (version 2026-10-08) and the counter larkfield.run.cost. If two tools disagree on cost, check their price tables first, as Module 5 showed.
Does your answer have the main points of ours?
Sign in and enroll in the course to save your answers. Every check counts toward the certificate.
Recap
- A second tool is a second exporter and pipeline in the Collector. The application does not change.
- The new pipeline reuses the redaction. With content capture on, no prompt text, email address or card number left for Langfuse.
session.id= the run’s ID on every span, so Langfuse shows a run’s two traces as one session.- Langfuse typed our spans from the GenAI names: generations, tools, agents. It computed no cost: it has no price for our models.
- Grafana answers “what is wrong in the system”; Langfuse answers “what did the model calls of this run do, and how were they reviewed”.
- Your project is the course’s finished project, the snapshot
end-of-m08: 114 tests pass.
You can now send the same data to two tools and read one run in both. But your team cannot run every tool, and each tool has its own licence, data rules and price. Next, you compare the main tools on stated criteria and choose a set for a team.
Next: Choose tools for a team