
Search runs with TraceQL
- Lesson 13
- 40 min
- Module 4: Find agent failures in Grafana
Where we are
In the last lesson, we read one run's waterfall and found its slow step, its expensive step and the step that sent the second refund. But the saved week has 316 runs in 434 traces, and we cannot open them one by one. In this lesson, we search runs by their structure: many calls to one tool, a write with no approval before it, an error followed by a resolved outcome. We start with the search box of an email inbox.
Lesson 13 of 28 · Observability for AI Agents: Traces, Costs and Audit TrailsSearch runs with TraceQL
1. Why agents need their own observability
2. OpenTelemetry for agents
3. Instrument the workflow
4. Find agent failures in Grafana
5. Cost
6. Audit trails
7. Alerts, service levels and quality
8. Tools: Langfuse, others and the run inspector
What you will be able to do
Find the runs that matter in a whole week by the shape of their spans, with TraceQL in Grafana and with obs find on the saved telemetry. Read each query’s result, and check what it can miss.
Before you startWhat to know and to have ready
What you need to know
- How to read a waterfall: rows, parents, errors, retries and gaps, from Read a run.
- The tool, write and approval spans and their attributes (
gen_ai.tool.name,larkfield.tool.kind,larkfield.write.outcome), from Tool calls, errors and retries. - Tail sampling in the Collector, from The Collector.
What you need on your computer
- The project
~/projects/observable-workflowas the last lesson left it (the snapshotend-of-m03, 86 tests pass), and the labs repository in~/projects/nextia-learning-labs. - Optional: Grafana with the replayed week sent to it, as in Read a run. Every step works without it.
Tested on macOS (Apple silicon) with Python 3.12.13. The Windows (PowerShell) and Linux commands are written, and the course did not run them. The TraceQL queries were run by the course team in grafana/otel-lgtm 0.36.0.
An inbox search
Section titled “An inbox search”Your work inbox has 2,000 emails. Grace asks: “Which customers sent us a photo last week, and got no answer?” You do not open 2,000 emails. You type a search: from customers, with an attachment, in the last week, with no reply. Each condition is about one part of an email. The result is a short list of whole emails, and you open only those.
A search like this has three parts. Conditions on the parts of each item. A way to combine them (“and”, “with no”). And a result that is a list of items, not of parts.
The problem: 316 runs, and the question is about their shape
Section titled “The problem: 316 runs, and the question is about their shape”Grace’s question for the agent is: “Which runs had an error, and were still closed as resolved?” The list of runs cannot answer it. obs runs prints one line per run: the outcome, the counts and the cost. It shows resolved for 203 runs, and it shows no error at all, because errors are in the spans.
You could open each waterfall. At one minute per run, 316 runs take more than five hours. You would also make mistakes by the fortieth run. Worse, the question is about the structure of a run: one span with an error, and another span with the outcome resolved. A total or a list never holds structure.
The idea: conditions on spans, a result of traces
Section titled “The idea: conditions on spans, a result of traces”TraceQL, the Trace Query Language, is the search language of Tempo, the trace store in Grafana. It works like the inbox search. A query has conditions on spans, and its result is a list of traces that have spans that match.
The pieces you need:
- A spanset filter, in braces:
{ span.gen_ai.tool.name = "get_order" }selects the spans whose attributegen_ai.tool.nameisget_order.span.means an attribute of the span. A few fields have no prefix:name,status(ok,error),durationandrootName(the name of the trace’s root span). - Comparisons:
=,!=,>and<, and=~for a pattern:=~ "done|timeout"means “done or timeout”.!~means “does not match”. &&inside the braces means “the same span has both”.{ A } && { B }means “the trace has a span for A and a span for B”: maybe two different spans.- A pipeline, after
|:| count() > 1keeps the traces whose matching spans number more than 1.
Remember one thing above all: TraceQL finds traces, not runs. A run that waited for a person has two traces. A query about the writes finds trace 2, and you follow its link to trace 1 yourself.
The course’s query sheet, grafana/traceql.md, holds one query per question. obs find asks the same questions of the saved telemetry, without Grafana.
Worked example: build the duplicate-write query
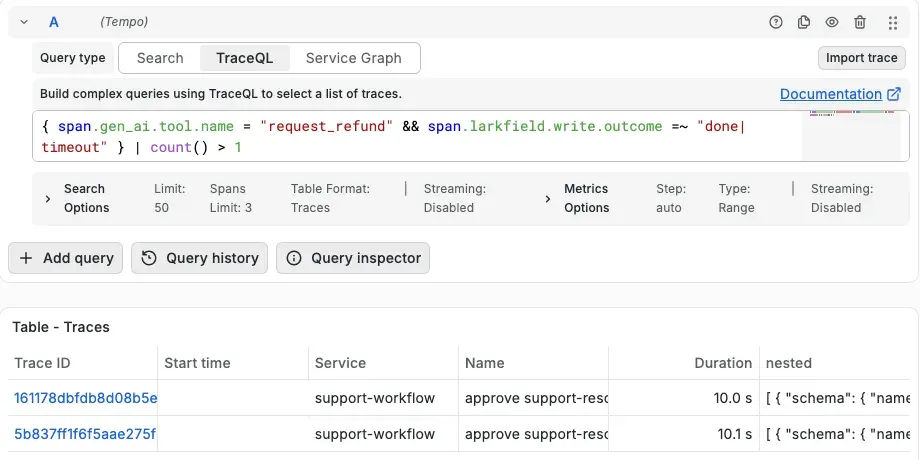
Section titled “Worked example: build the duplicate-write query”Build one query of the sheet in steps, and watch each step’s result. The question: “Which traces have more than one refund call that may have paid?” The counts are from the saved week: the course’s script applied each step’s conditions to all 434 traces.

Text description of the diagram
The saved week has 434 traces and 2,027 spans. Step 1 keeps the spans whose tool is request_refund: 45 spans in 39 traces. Step 2 adds a second condition on the same span, an outcome of done or timeout: 41 spans in 39 traces. These are the refund calls that may have paid. Step 3 counts those spans in each trace, and keeps the traces with more than one. That leaves 2 traces: trace 2 of R-1014-040 and trace 2 of R-1014-051. Step 4 opens them: each has two refunds of 9.95, the second with a new key.
Read each step:
{ span.gen_ai.tool.name = "request_refund" }keeps every refund call: 45 spans in 39 traces. Some traces have more than one span: a refused call and a retry, for example.{ span.gen_ai.tool.name = "request_refund" && span.larkfield.write.outcome =~ "done|timeout" }drops the calls that surely changed nothing, such asunavailable(refused at once). 41 spans in 39 traces are left. Atimeoutstays, because a timed-out call may have paid.… | count() > 1keeps the traces with more than one such span: 2 traces, the second traces of R-1014-040 and R-1014-051.
Why step 3? Because 39 traces made one refund, and that is normal work. The failure is not “a refund”. It is two refunds in one trace: a shape. Only the count turns the first two steps into a search for that shape.
Step 4 is yours: open the two traces. Each has a refund of 9.95 that timed out and a second refund with a new key. They are the week’s two double refunds. In Grafana, the course team’s run of this query returned the same 2 traces.
Add the lesson’s files
Section titled “Add the lesson’s files”The snapshot end-of-m04 adds obs find and the five failure rules (obs/flags.py, for the next lesson). It also adds the TraceQL sheet and a Grafana dashboard with one panel per query.
-
Copy the files. In
~/projects/observable-workflow:Terminal window S=../nextia-learning-labs/C31/snapshots/end-of-m04cp $S/obs/flags.py $S/obs/model.py $S/obs/__main__.py obs/cp $S/grafana/traceql.md grafana/cp $S/grafana/dashboards/agent-traces.json grafana/dashboards/cp $S/tests/test_obs_cli.py tests/Terminal window $S = "..\nextia-learning-labs\C31\snapshots\end-of-m04"Copy-Item $S\obs\flags.py, $S\obs\model.py, $S\obs\__main__.py obs\Copy-Item $S\grafana\traceql.md grafana\Copy-Item $S\grafana\dashboards\agent-traces.json grafana\dashboards\Copy-Item $S\tests\test_obs_cli.py tests\Terminal window S=../nextia-learning-labs/C31/snapshots/end-of-m04cp $S/obs/flags.py $S/obs/model.py $S/obs/__main__.py obs/cp $S/grafana/traceql.md grafana/cp $S/grafana/dashboards/agent-traces.json grafana/dashboards/cp $S/tests/test_obs_cli.py tests/ -
Run the tests:
Terminal window python -m pytest -qThe last line says
87 passed, 1 skipped, 1 deselected. The new test runsobs findon the saved week.
Three searches by structure
Section titled “Three searches by structure”Each search below has three parts. First the TraceQL query from the sheet, then the same question with obs find on the saved week. Last, what you see when you open the results.
More than N calls to the same tool
Section titled “More than N calls to the same tool”An agent that calls one tool again and again may be stuck. The sheet’s query:
{ span.gen_ai.tool.name = "get_order" } | count() > 2In Tempo, it returned 0 traces. obs find agrees:
python -m obs find --data data/telemetry/week --tool get_order --min-calls 30 match(es) in 316 run(s)Zero is a result, but is the threshold right? Lower it to 2:
python -m obs find --data data/telemetry/week --tool get_order --min-calls 2R-1012-004 T-90601 Mon 05:42 chat-small get_order called 2 timesR-1012-031 T-90201 Mon 15:07 chat-small get_order called 2 times…R-1017-026 T-90601 Sat 18:17 chat-strong get_order called 2 times13 match(es) in 316 run(s)Now 13 runs match. Open the first one:
python -m obs trace R-1012-004 --data data/telemetry/weekTrace 1 98cb994f5d69bd8964562841548f2855 Mon 12 Oct 05:42:07 13.2 s 0.0 s |========================| 13.17 s invoke_agent support-resolver reply_only rule W1 0.0 s |== | 0.92 s chat chat-small 2159 in / 21 out US$0.00023 tool_calls 0.9 s | =================== | 10.00 s execute_tool get_order ERROR service_timeout LK-645001 10.9 s | === | 0.89 s chat chat-small 2222 in / 21 out US$0.00023 tool_calls 11.8 s | = | 0.00 s execute_tool get_order ok LK-645001 11.8 s | ===| 1.35 s chat chat-small 2463 in / 77 out US$0.00028 tool_calls 13.2 s | =| 0.00 s execute_tool send_reply sent
Outcome: resolvedTwo calls, and the first one timed out. The model asked again, the second call worked, and it replied. That is a good recovery, not a loop. So the number N is a choice, and you make it from the data. In this week, no run called get_order three times, and every two-call run that you open looks like this one. A loop shows in another way here: the agents course’s loop limits stop the run. The loop query of the next lesson looks for that stop.
A write without an approval before it
Section titled “A write without an approval before it”Larkfield’s rule: no refund, label or reshipment without a person’s decision. The sheet’s query:
{ rootName !~ "approve.*" && span.larkfield.tool.kind = "write" && span.gen_ai.tool.name != "send_reply" }It looks for a write span (not the reply) in a trace whose root span is not a person’s decision. In Tempo, 0 traces. obs find agrees:
python -m obs find --data data/telemetry/week --write-without-approval0 match(es) in 316 run(s)Is 0 good news, or a query that cannot match? Check it. Drop the rootName condition, and the course’s script finds 118 traces with a write in the saved week. Every one of them has the root approve support-resolution. So the query can see writes, and every write came after a decision. In this workflow, a write can only happen in trace 2, which starts with the person’s decision. That is the design of Module 3, and the query checks that the design holds.
An error followed by a resolved outcome
Section titled “An error followed by a resolved outcome”Now Grace’s question. The sheet’s query:
{ span.larkfield.tool.kind = "read" && status = error } && { span.larkfield.outcome = "resolved" }Two spansets: a read that failed, and a span with the outcome resolved, in the same trace. In Tempo, 8 traces. obs find:
python -m obs find --data data/telemetry/week --error-then-resolvedR-1012-004 T-90601 Mon 05:42 chat-small a tool error, then resolvedR-1013-038 T-90601 Tue 15:57 chat-small a tool error, then resolvedR-1014-021 T-90601 Wed 12:41 chat-strong a tool error, then resolvedR-1016-040 T-80009 Fri 14:59 chat-strong a tool error, then resolvedR-1016-044 T-80009 Fri 15:35 chat-strong a tool error, then resolvedR-1017-026 T-90601 Sat 18:17 chat-strong a tool error, then resolvedR-1018-010 T-90602 Sun 11:15 gemma3:4b a tool error, then resolvedR-1018-022 T-90601 Sun 17:00 gemma3:4b a tool error, then resolved8 match(es) in 316 run(s)Like the query, obs find looks at failed reads only. A failed write is another question, the duplicate write of the next lesson.
Eight runs. Are they eight failures? Open R-1014-021:
python -m obs trace R-1014-021 --data data/telemetry/weekTrace 1 3492400f6a05ceaeac2f8fcf3013de34 Wed 14 Oct 12:41:26 16.1 s 0.0 s |========================| 16.15 s invoke_agent support-resolver reply_only rule W1 0.0 s |=== | 1.86 s chat chat-strong 2156 in / 49 out US$0.00480 stop 1.9 s | ================ | 10.00 s execute_tool get_order ERROR service_timeout LK-645001 11.9 s | === | 1.90 s chat chat-strong 2248 in / 58 out US$0.00508 stop 13.8 s | = | 0.00 s execute_tool get_order ok LK-645001 13.8 s | ====| 2.37 s chat chat-strong 2527 in / 107 out US$0.00612 stop 16.1 s | =| 0.00 s execute_tool send_reply sent
Outcome: resolvedThe error was repaired: a later get_order call worked. Six of the eight runs look like this. In two, R-1018-010 and R-1018-022, no later call of the failed tool worked. Yet the run replied and closed as resolved. Those two are the dangerous ones.
So the query found the right place, but it is too wide. It also has a limit that you must know: && between two spansets means “both are in the trace”, not “one comes after the other”. Here it works, because the outcome is set when the run closes, after every tool call. And the query cannot say “no later call of the same tool succeeded”. That needs a rule that reads the spans in order. The next lesson writes it.
TraceQL in Grafana
Section titled “TraceQL in Grafana”If Grafana has the replayed week, run the sheet’s queries there:
- Open Grafana at
http://localhost:3031, then Explore. Choose the data source Tempo and the query type TraceQL. - Set the time range to cover the replay. The week took about 10 minutes of real time. Choose a range that starts before you sent it, for example Last 3 hours.
- Copy a query from
grafana/traceql.mdinto the editor, and run it. The result is a table of traces: trace ID, start time, service, root name and duration. - Click a trace ID to open its waterfall, as in the last lesson.
The dashboard Support workflow: failure patterns in traces (grafana/dashboards/agent-traces.json) runs seven of the sheet’s queries for you, one table panel per query.
Tempo searches only what was kept
Section titled “Tempo searches only what was kept”The Collector of Module 2 samples traces at the tail. It keeps every trace with an approval, a write, an error or injected input, and 10% of the others. In the course team’s check of the Collector, it kept 275 of the week’s 434 traces. A search can only find kept traces. Compare the two answers for each query of the sheet:
Text description of the chart
One bar per query that matches at least one saved trace. loop: Tempo 3 of 3 saved traces; hidden tool error: Tempo 8 of 8 saved traces; duplicate write: Tempo 2 of 2 saved traces; no action: Tempo 4 of 4 saved traces; injected input: Tempo 20 of 20 saved traces; slow model calls: Tempo 14 of 17 saved traces; expensive runs: Tempo 23 of 39 saved traces; a model's runs: Tempo 15 of 16 saved traces. The five failure queries are at 100%: loop, hidden tool error, duplicate write, no action and injected input. The Collector keeps every trace with an error, a write, an approval or injected input. The three that are not failures lose traces: slow model calls, gemma3:4b runs and runs that cost more than 1 cent.
Every failure query found all of its traces, because the sampling rules keep exactly those traces. The others did not. Tempo returned 14 of the 17 traces with a slow model call, and only 23 of the 39 runs over 1 cent. A run over 1 cent with no approval, no write and no error is kept only when the 10% sample picks it. So “how many expensive runs?” has no answer in Tempo. Counts belong to the metrics, which are never sampled. The last lesson of this module uses them.
Common mistake
The query returns No rows, with no error
Symptom: you paste a query in Explore, and the table says No rows. You expected some traces.
Cause: one of three. The time range does not cover the replay. An attribute name has a typo: TraceQL does not say “unknown attribute”, it just matches nothing. Or the trace was not kept by the sampling.
Diagnose: run the widest query first, { span.larkfield.ticket.id = "T-90104" }. If it returns nothing, the time range is wrong. If it works, check your attribute names against a span’s attributes in the waterfall, or against grafana/traceql.md.
Recover: widen the time range, copy the names from the sheet, and remember that a dropped trace cannot be found. obs find reads every saved trace.
Common mistake
A query returns exactly 50 traces
Symptom: a query returns exactly 50 traces, and you expected more.
Cause: Grafana’s TraceQL search has a limit, 50 traces by default (Search Options → Limit). It shows at most that many.
Recover: raise the limit in Search Options for that query. Never read a TraceQL table as a count of a whole week: use obs find, or a metric, to count.
Your turn: another tool, the same question
Section titled “Your turn: another tool, the same question”Change one condition: search for runs that called get_payments at least twice.
-
Predict: the payment service had practice failures this week. Do you expect runs that called
get_paymentstwice? Will the model have recovered, as in R-1012-004? -
Search:
Terminal window python -m obs find --data data/telemetry/week --tool get_payments --min-calls 2 -
Open the first result with
python -m obs trace RUN --data data/telemetry/week. Then write the TraceQL query that would find the same traces in Grafana.
Check your prediction
R-1013-025 T-90602 Tue 13:35 chat-small get_payments called 2 timesR-1014-034 T-90602 Wed 15:05 chat-small get_payments called 2 timesR-1016-003 T-90602 Fri 03:02 chat-small get_payments called 2 times3 match(es) in 316 run(s)All three are ticket T-90602, whose recorded practice fault is a payment service that is down. Open R-1013-025:
     1.0 s |      ==                |   0.20 s    execute_tool get_payments  ERROR service_unavailable  LK-645112     1.2 s |       =======          |   0.97 s    chat chat-small  2530 in / 22 out  US$0.00026  tool_calls     2.2 s |              =         |   0.20 s    execute_tool get_payments  ERROR service_unavailable  LK-645112     2.4 s |               =========|   1.31 s    chat chat-small  2596 in / 105 out  US$0.00031  tool_calls
Outcome: handed_to_person
Both calls failed, and chat-small handed the ticket to a person. That is the right outcome for this ticket by the course’s labels. Compare it with R-1018-010 from the last lesson: the same ticket and the same failed tool. But gemma3:4b replied and closed it as resolved. The TraceQL query: { span.gen_ai.tool.name = "get_payments" } | count() > 1.
When to use TraceQL, and what it costs
Section titled “When to use TraceQL, and what it costs”Use TraceQL when the question is about the shape of a run: which spans, with which attributes, how many, under which root. It is fast for an engineer who knows the attribute names, and every result is a trace that you can open.
It has limits. It finds traces, so a run with two traces needs two steps. It checks “and” between spansets, not “after”. It searches only the traces that the sampling kept, and the search limit cuts long lists. Each query also needs a careful threshold, like N in “more than N calls”. Write the queries once, in a sheet that your team shares, and test each one on a run that should match. The next lesson turns the queries into five named patterns, each with a rule that reads the spans in order.
Knowledge check
Section titled “Knowledge check”Check your understanding
The query { span.gen_ai.tool.name = "request_refund" && span.larkfield.write.outcome =~ "done|timeout" } matched 39 traces. Why is that not a list of 39 problems, and what turns it into a search for double refunds?
Show the answer
Each of the 39 traces made at least one refund that may have paid, and one refund is normal work. The failure is a shape: two such refund calls in one trace. The pipeline | count() > 1 keeps only the traces with more than one matching span. That left 2 traces: the second traces of R-1014-040 and R-1014-051.
Does your answer have the main points of ours?
Sign in and enroll in the course to save your answers. Every check counts toward the certificate.
Check your understanding
obs find --error-then-resolved found 8 runs. How many of them are real failures, and what does the query not check?
Show the answer
Two: R-1018-010 and R-1018-022, where no later call of the failed tool succeeded and the run still closed as resolved. In the other six, a later call of the same tool worked, so the error was repaired. The query checks only that a failed read and a resolved outcome are in the same trace. It does not check the order of the spans, or whether a later call repaired the error.
Does your answer have the main points of ours?
Sign in and enroll in the course to save your answers. Every check counts toward the certificate.
Check your understanding
Practical: write a TraceQL query that finds traces where a write happened with no person's decision as the root. Then say why 0 results is good news here only after a check.
Show the answer
{ rootName !~ "approve.*" && span.larkfield.tool.kind = "write" && span.gen_ai.tool.name != "send_reply" }. Zero results can also mean a query that never matches: a typo, or the wrong attribute. Check that it can match: drop the rootName condition. The saved week then has 118 traces with a write, all with the root approve support-resolution. So the query sees writes, and every write came after a decision.
Does your answer have the main points of ours?
Sign in and enroll in the course to save your answers. Every check counts toward the certificate.
Recap
- TraceQL puts conditions on spans and returns traces.
{ … && … }is one span,{ A } && { B }is two spansets in one trace, and| count() > Ncounts the matching spans of each trace. - Built step by step, the duplicate-write query went from 45 refund spans in 39 traces to 2 traces: the week’s two double refunds.
- More than N calls: 0 with N = 2, 13 with N = 1, and the two-call runs were recoveries. A write without an approval: 0, and a check showed that the query can see the 118 traces with writes. An error, then resolved: 8 runs, of which 2 were not repaired.
- Tempo searches only the kept traces: every failure query found all its traces, but only 23 of 39 runs over 1 cent were kept.
Your project now has obs find, the TraceQL sheet and the traces dashboard: 87 tests pass. You can now search a week by the shape of its runs. But each query is still a rough net: it also catches repaired errors, and it cannot read spans in order. Next, you meet the five failure patterns of agents, each with its signature in a trace and a rule that finds it.
Next: Agent failure patterns