
Meet the live workflow
- Lesson 3
- 40 min
- Module 1: Why agents need their own observability
Where we are
We now know which signals we need and which data stays out. So far they are only names on a map. In this lesson, we set up the workflow on our own computer, cause the double refund ourselves, and read the saved telemetry of Larkfield's week with the obs tool, so that every later lesson changes something we have seen run. We start in a flight simulator.
Lesson 3 of 28 · Observability for AI Agents: Traces, Costs and Audit TrailsMeet the live workflow
1. Why agents need their own observability
2. OpenTelemetry for agents
3. Instrument the workflow
4. Find agent failures in Grafana
5. Cost
6. Audit trails
7. Alerts, service levels and quality
8. Tools: Langfuse, others and the run inspector
What you will be able to do
Set up Larkfield’s live workflow on your computer, cause the double refund yourself, and read the saved telemetry of Larkfield’s week with obs. You also learn which evidence in this course is replayed, simulated or measured, and how to start again.
Before you startWhat to know and to have ready
What you need to know
- The double refund of run R-1014-040, from A refund nobody can explain.
- The four signals and what each one answers, from What to record, and what not to.
- How to use a terminal, a virtual environment and
pip. The agents course used the same steps.
What you need on your computer
- The project
~/projects/observable-workflowfrom the first lesson of this module, and the labs repository in~/projects/nextia-learning-labs. - Python 3.12 or newer. Check with
python3.12 --versionon macOS and Linux, orpy -3.12 --versionon Windows. - An internet connection, once, for
pip. The virtual environment takes about 90 MB.
You need no account, no key and no payment. Docker is optional, and not needed in this module. Tested on macOS (Apple silicon) with Python 3.12.13. The Windows (PowerShell) and Linux commands are written for you, but the course did not run them.
A flight simulator
Section titled “A flight simulator”Pilots practise an engine failure in a flight simulator. The simulator plays the aircraft’s real behaviour, measured on real flights. The instructor makes the engine fail on purpose, at a moment that she chooses. Nobody is in danger, and the same failure can come back for every student, in the same way.
After the exercise, the instructor and the pilot watch the recording of the flight together. They see each control the pilot touched, and when. The recording is the point of the exercise: it turns “I think I did the right thing” into evidence.
This course works the same way. The model’s behaviour is real and recorded. The failures are caused on purpose. And the telemetry is the recording that you learn to read.
The problem: you cannot practise on a live help desk
Section titled “The problem: you cannot practise on a live help desk”Amira cannot learn to find double refunds by waiting for real customers to be refunded twice. A real model may also answer differently tomorrow, so a lesson could not show the output that you will see. And one bad week at Larkfield is hundreds of runs: nobody can cause them by hand.
So the course does what the simulator does. It plays back real model decisions, causes the failures on purpose, and saves the telemetry of a whole week for you to read.
The idea: replayed, simulated and measured
Section titled “The idea: replayed, simulated and measured”Every piece of evidence in this course has a label. Use the same labels in your own notes:
| Label | What it is | Examples |
|---|---|---|
| replayed | a real answer of a real model, recorded by the agents course and played back | the decisions of chat-small, chat-strong and gemma3:4b, with their tokens and latency |
| simulated | behaviour that the course made up to practise a situation | the week’s traffic, the slow payment service, the reply service that is down, when people approve |
| constructed | a case or a bug that the course author wrote on purpose | one run where a scripted model obeys an injected instruction, in Module 4 |
| measured | a number from a run of the course’s code | your own runs, and the course team’s runs on a laptop |
| assumption | a stated value, such as a budget or a retention period | the 7 years of the audit trail; Omar’s budget per resolved ticket |

Text description of the diagram
Two sources feed everything. The replayed recordings are the agents course’s real model answers, with their tokens and latency. The simulated parts are the week’s traffic, the faults and the times when people approve. When you run a ticket, the mock provider answers from the recordings, and options such as –fault and –naive-retry add a simulated fault. Your run writes to the folder work/: a practice database and a log. The course team used the same two sources to make the replayed week, saved in data/telemetry/week, which you read with python -m obs.
The mock provider is the agents course’s replay of its recordings. When the workflow sends a request to a model, the mock finds the recorded request and gives back the recorded answer. So your run of ticket T-90104 makes exactly the decision of run R-1014-040 in the saved week.
One detail follows from the replay. The workflow’s date rules use the agents course’s “today”, Friday 9 October 2026, so that every recording replays exactly. That is why the reply says that the order is “12 business days late” in any week. The saved week runs from Monday 12 to Sunday 18 October, Toronto time. Never compute a delay from the week’s timestamps: use the values that the workflow recorded.
Set up the project
Section titled “Set up the project”-
Move into the project:
Terminal window cd ~/projects/observable-workflow -
Make and activate a virtual environment with Python 3.12:
Terminal window python3.12 -m venv .venvsource .venv/bin/activateTerminal window py -3.12 -m venv .venv.venv\Scripts\Activate.ps1Terminal window python3.12 -m venv .venvsource .venv/bin/activateThe prompt now starts with
(.venv). From here, typepythonon every system. Activate the environment again in every new terminal. -
Install the pinned packages:
Terminal window python -m pip install -r requirements-dev.txtThis takes less than a minute. The last lines may suggest a newer
pip. You can ignore that. -
Run the tests of the snapshot:
Terminal window python -m pytest -qThe last line:
72 passed, 1 deselected in 3.26sYour time differs. 69 of the 72 tests are the agents course’s own tests of the workflow. The deselected test calls a real provider, and runs only if you ask for it.
Run one ticket
Section titled “Run one ticket”Ticket T-80008 asks where a garden shed is. Run it:
python -m resolver run T-80008The output, replayed:
Run T-80008-agent-chat-small-1 | single agent with tool calling: the model chooses every step | chat-smallOutcome: reply_only (rule W1) | 2 model call(s), 1 tool call(s) | 4580 tokens in, 117 out | US$0.00052Reply draft: Your garden shed order LK-581106 shipped on Monday, October 5. Its expected delivery date is Tuesday, October 13. It is currently in transit, and there is no delivery date showing yet.Reply sent. Ticket: resolved.The first two lines are the agents course’s summary of the run. They give the design, the model, the outcome and its policy rule, the calls, the tokens and the cost. The last line is the live workflow’s addition: it sent the reply and closed the ticket. This ticket needs no change, so no approval.
The workflow also wrote its one log line, in work/logs/workflow.log:
…-04:00 INFO ticket=T-80008 run=T-80008-agent-chat-small-1 model=chat-small status=resolved writes=0 reply=sentYour line starts with the date and time of your run. The folder work/ holds everything that your runs make: the practice database, the run states and the log. Git ignores it.
Worked example: cause the double refund
Section titled “Worked example: cause the double refund”Now make the double refund of the first lesson on your own computer. You need three commands: run the ticket, approve it with the fault and the naive retry, and list the changes.
-
Run ticket T-90104 the way release 2.1.0 ran it, with the structured agent on chat-strong:
Terminal window python -m resolver run T-90104 --variant agent_structured --model chat-strongThe output is long. Its first two lines and its last line:
Run T-90104-agent_structured-chat-strong-1 | single agent with one JSON step per call (for models without tool calling) | chat-strongOutcome: resolve (rule W2) | 2 model call(s), 1 tool call(s) | 4586 tokens in, 265 out | US$0.01182…Nothing has changed yet. Next: python -m resolver approve T-90104-agent_structured-chat-strong-1 --as agent (or: reject)In between, it prints the proposal:
request_refund LK-793996 9.95 CAD RFD-LATE, who may approve it, the reason, the evidence and the reply draft. The tokens and the cost are the same as run R-1014-040’s: the same recorded decision. -
Approve it as Sam, with the slow payment service and the naive retry:
Terminal window python -m resolver approve T-90104-agent_structured-chat-strong-1 --as agent --name Sam --fault request_refund:timeout_after_write --naive-retryrequest_refund LK-793996: done (operation 797fbb5bbb9f8a7e, 2 call(s))Status: doneReply sent. Ticket: resolved.--fault request_refund:timeout_after_writemakes the practice payment service make the refund and then answer too late.--naive-retryis Tomás’s retry of release 2.1.0. Both are simulated. Look at the first line: one operation, done, “2 call(s)”. The workflow’s own summary hides the second refund. -
List the changes in the practice database:
Terminal window python -m resolver changes… T-90104 request_refund LK-793996 9.95 RFD-LATE (operation 797fbb5bbb9f8a7e)… T-90104 request_refund LK-793996 9.95 RFD-LATE (operation 797fbb5bbb9f8a7e-retry1)2 change(s) in the practice databaseTwo refunds of 9.95, with two different keys. The practice database is the “payment service” here: the system of record. Your lines start with the time of your run.
-
Read the last line of your log:
Terminal window tail -1 work/logs/workflow.logTerminal window Get-Content work\logs\workflow.log -Tail 1Terminal window tail -1 work/logs/workflow.log…-04:00 INFO ticket=T-90104 run=T-90104-agent_structured-chat-strong-1 model=chat-strong status=resolved writes=1 reply=sent
You made the first lesson’s contradiction yourself: two changes in the system of record, and a log line that says writes=1. The keys show where the second refund came from: 797fbb5bbb9f8a7e is the planned operation, and -retry1 is the retry that gave it a new key.
The agents course’s printed trace
Section titled “The agents course’s printed trace”The agents course had a command that prints a run’s steps. Try it:
python -m resolver trace T-90104-agent_structured-chat-strong-1Run T-90104-agent_structured-chat-strong-1: agent_structured, chat-strong, ticket T-90104, status done2 model call(s), 4586 tokens in, 265 out, US$0.01182, 6.559 s waiting for the model
1 plan ["Check delivery status and lateness.", "Apply delivery policy and draft a reply."] 1 model chat-strong: get_order({"order_id": "LK-793996"}) (2160 in, 47 out, 2.388 s) 1 tool get_order({"order_id": "LK-793996"}) -> ok 2 plan [] 2 model chat-strong: finish({"outcome": "resolve", "rule": "W2", "a…) (2426 in, 218 out, 4.171 s) 2 proposal resolve (W2): request_refund LK-793996 2 stop finished 2 approval approved by usr-sam (agent) 2 write request_refund op 797fbb5bbb9f8a7e -> timeout 2 write request_refund op 797fbb5bbb9f8a7e-retry1 -> done 2 stop doneThis shows both writes, so why is it not enough? Sam asks the same question. Amira answers: “It reads the run’s saved state in work/runs.sqlite, on the computer that ran it. Nobody else can see it, and it has no time for each step and no wait. It cannot search the 316 runs of a week, and no dashboard can count it.” It is a debugging print for one run. Module 2 turns the same steps into a trace that leaves the workflow.
Add the lesson’s files
Section titled “Add the lesson’s files”The snapshot end-of-m01 adds four things. obs is the course’s tool that reads saved telemetry. data/telemetry/ holds the saved telemetry of Larkfield’s week. auditstore/ is the audit store’s reader, and grafana/ holds Grafana’s files. Your own workflow still records no telemetry: Module 2 adds that.
-
Copy the files from the snapshot
end-of-m01. In~/projects/observable-workflow:Terminal window S=../nextia-learning-labs/C31/snapshots/end-of-m01cp -R $S/obs $S/auditstore $S/grafana .cp -R $S/data/telemetry data/cp $S/tests/test_obs_cli.py tests/cp $S/README.md .Terminal window $S = "..\nextia-learning-labs\C31\snapshots\end-of-m01"Copy-Item -Recurse $S\obs, $S\auditstore, $S\grafana .Copy-Item -Recurse $S\data\telemetry data\Copy-Item $S\tests\test_obs_cli.py tests\Copy-Item -Force $S\README.md .Terminal window S=../nextia-learning-labs/C31/snapshots/end-of-m01cp -R $S/obs $S/auditstore $S/grafana .cp -R $S/data/telemetry data/cp $S/tests/test_obs_cli.py tests/cp $S/README.md . -
Run the tests again:
Terminal window python -m pytest -qThe last line now says
76 passed, 1 deselected. Your project is now the same as the snapshotend-of-m01.
The saved telemetry has two weeks. data/telemetry/week is Larkfield’s week, with every practice incident: 316 runs, 434 traces, 2,027 spans, 503 events and 1,331 audit records. data/telemetry/healthy-week is the same tickets on release 2.0.0, with no incident, for comparison in Module 7. Each folder holds the traces, metrics and logs as OpenTelemetry’s JSON format (*.jsonl.gz), and the audit trail (audit.jsonl).
Read the replayed week with obs
Section titled “Read the replayed week with obs”obs reads saved telemetry. With --data, it reads a saved week; without it, your own runs, from Module 2 on.
The runs of one day
Section titled “The runs of one day”python -m obs runs --data data/telemetry/week --day wed --limit 8run ticket started outcome model tools appr cost US$ secs model flagsR-1014-045 T-90304 Wed 18:27 handed_to_person 2 1 0 0.00052 2.8 chat-small -R-1014-046 T-80001 Wed 18:59 handed_to_person 1 0 0 0.00027 1.8 chat-small -R-1014-047 T-90406 Wed 19:07 resolved 2 1 0 0.01148 6.4 chat-strong -R-1014-048 T-90502 Wed 19:13 resolved 4 3 0 0.00111 5.4 chat-small -R-1014-049 T-90505 Wed 19:24 handed_to_person 1 0 0 0.00026 1.4 chat-small -R-1014-050 T-90303 Wed 19:24 handed_to_person 1 0 0 0.00027 1.6 chat-small -R-1014-051 T-90606 Wed 19:31 resolved 2 1 1 0.01181 6.1 chat-strong -R-1014-052 T-80004 Wed 19:45 handed_to_person 1 0 0 0.00027 1.8 chat-small -52 run(s), 0 flagged (last 8 shown)One line per run, from the telemetry, not from the log. After the outcome come the model calls (model), the tool calls (tools), the approval requests (appr) and the cost. secs is the length of the agent’s work, without the wait for a person. Then the model’s name. The last column, flags, is empty for now. In Module 4, obs learns to flag the failure patterns of agents, and this column fills.
Look at R-1014-051, on ticket T-90606. Like R-1014-040, it ran on chat-strong, asked for one approval and ended resolved. Keep it in mind for your turn below.
The double refund, as a trace
Section titled “The double refund, as a trace”python -m obs trace R-1014-040 --data data/telemetry/weekRun R-1014-040 | ticket T-90104 | chat-strong (agent_structured) | release 2.1.0 | language en2 model call(s), 1 read(s), 2 write call(s), 4586 tokens in, 265 out, US$0.01182
Trace 1 f0433c4403e2767e1d69ece18a947526 Wed 14 Oct 17:52:00 6.6 s 0.0 s |========================| 6.56 s invoke_agent support-resolver resolve rule W2 0.0 s |========= | 2.39 s chat chat-strong 2160 in / 47 out US$0.00479 stop 2.4 s | = | 0.00 s execute_tool get_order ok LK-793996 2.4 s | ================| 4.17 s chat chat-strong 2426 in / 218 out US$0.00703 stop 6.6 s | =| 0.00 s approval.request needs agent
... waited 15 h 25 min for a person (this trace has a link to 78d246ee22e5f5ef in trace f0433c44...)Trace 2 15ba0d9388d1b9e001af373f21c4b955 Thu 15 Oct 09:17:12 10.0 s 0.0 s |========================| 10.01 s approve support-resolution approved by usr-sam (agent, limit 100) 0.0 s |========================| 10.00 s execute_tool request_refund ERROR timeout LK-793996 9.95 RFD-LATE key 797fbb5bbb9f8a7e 10.0 s | =| 0.00 s execute_tool request_refund done LK-793996 9.95 RFD-LATE key 797fbb5bbb9f8a7e-retry1 10.0 s | =| 0.00 s execute_tool send_reply sent
Outcome: resolvedThis is a waterfall: one line per span, in time order. Read it from the left:
- The offset (
0.0 s,2.4 s): when the span started, counted from the start of its trace. - The bar: where the span sits in the trace’s time. A span that is indented is a child of the span above it.
- The duration (
2.39 s): how long the span lasted. The model spans last as long as the recorded calls did. - The name and the details:
chat chat-strongis a model call, with its tokens, cost and finish reason.execute_tool get_orderis a tool call.approval.requestis the moment the run asked for a person.
There are two traces. Trace 1 is Wednesday evening: two model calls, one read, then the request for approval. Then the run waited 15 h 25 min, and nothing ran. Trace 2 is Thursday morning: Sam’s approval, the refund that timed out after 10 seconds, the same refund with the -retry1 key, and the reply. Trace 2 carries a link to the approval request of trace 1, so a tool can join them. Module 3 shows how the workflow makes them.
Compare it with your own run’s printed trace above. The steps are the same, because the decisions are the same recordings. The saved trace adds times, durations, costs, the release, the person’s limit, and a format that tools can read.
The events and the audit trail
Section titled “The events and the audit trail”python -m obs events R-1014-040 --data data/telemetry/weekWed 14 Oct 17:52:06 larkfield.approval.waiting trace f0433c44 {"run.id": "R-1014-040", "ticket.id": "T-90104", "approval.needs_role": "agent"}Thu 15 Oct 09:17:22 larkfield.run.closed trace 15ba0d93 {"run.id": "R-1014-040", "ticket.id": "T-90104", "outcome": "resolved", "writes_done": 1, "reply": "sent", "helpdesk.status": "resolved"}Fri 16 Oct 09:17:12 gen_ai.evaluation.result trace f0433c44 {"gen_ai.evaluation.name": "sampled-review", "gen_ai.evaluation.score.value": 0.0, "gen_ai.evaluation.score.label": "fail", "run.id": "R-1014-040", "ticket.id": "T-90104", "reviewer": "usr-priya"}3 event(s)Three events with fixed names. The second, larkfield.run.closed, is the log line in a structured form, with the same writes_done: 1. The third is a sampled review a day later: Priya, who owns quality, marked this run fail: the customer got two refunds instead of one. The reviews are simulated: the agents course’s labels stand in for Priya’s judgement.
Then check the audit trail of the whole week:
python -m obs audit verify --data data/telemetry/weekThe audit trail is intact: 1331 records, the chain and the anchor match (head e378b7d00139f1c3).Every audit record holds the hash of the record before it, so the records form a chain. verify computes every hash again, and checks the last one against an anchor, a small file that stores the number of records and the last hash. If anybody changes or removes a record, verify says where. Module 6 builds this, and you break it on purpose there.
Grafana: optional, later in the course
Section titled “Grafana: optional, later in the course”Grafana is the tool that the course uses to search and draw telemetry. It runs in one Docker container, grafana/otel-lgtm, with Tempo, Prometheus and Loki inside. grafana/compose.yaml is in your project now.
Do not start it yet. Grafana shows the telemetry that the workflow sends to it, and your workflow sends nothing until Module 2. Read a run in Module 4 shows how to start it and send it a week. Every lesson also works without Grafana, with obs and the saved telemetry. If you plan to use it, check now that Docker Compose is installed:
docker compose versionIf this prints a version, you are ready. If it says that the command is not found, the Docker and cloud course shows how to install Docker. On the course team’s laptop, the container used 890 to 960 MiB of memory after it had stored the replayed week.
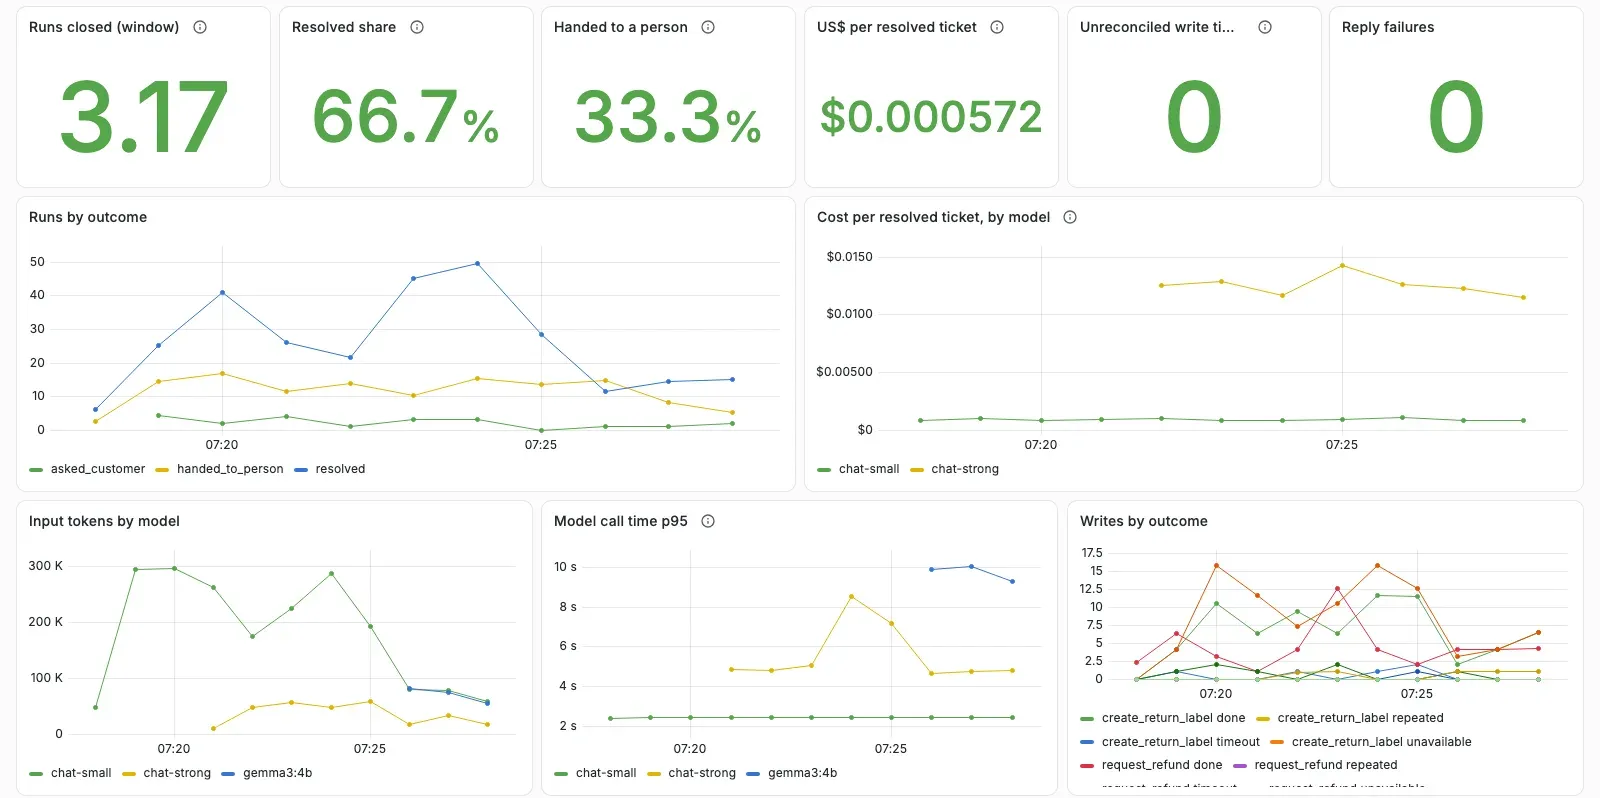
Stop and reset
Section titled “Stop and reset”Your runs left a practice database with two refunds, run states and a log. To start again, delete the folder work/:
-
Delete it:
Terminal window rm -rf workTerminal window Remove-Item -Recurse -Force workTerminal window rm -rf work -
Run one ticket and list the changes:
Terminal window python -m resolver run T-80008python -m resolver changesThe run ends with
Reply sent. Ticket: resolved., and the changes say0 change(s) in the practice database. The workflow made a fresh practice database.
python -m resolver reset only gives you a fresh practice database: it keeps your log and your run states. Delete work/ for a full reset. The saved weeks in data/telemetry/ never change, so you never need to reset them.

Text description of the diagram
First run python -m pytest -q. If it does not say 76 passed, check the folder, observable-workflow, and the prompt, (.venv). Then copy this lesson’s files again, and run the tests again. Then run ticket T-80008. If it does not end with Reply sent. Ticket: resolved., delete work/ and run it again. Then verify the saved week’s audit trail. If it says intact with 1331 records, you are ready. If not, copy data/telemetry again from the snapshot end-of-m01.
Common mistake
obs says there is no telemetry
Symptom: you run a ticket, then python -m obs runs, and it prints:
No telemetry in /Users/you/projects/observable-workflow/work/telemetry. Run a ticket first (python -m resolver run T-80008), or read the replayed week: --data data/telemetry/weekCause: at this stage, your workflow records no telemetry. It writes only its log line. The message’s advice to run a ticket is right from Module 2 on, when the workflow starts to record traces.
Recover: add --data data/telemetry/week to read the saved week. Read your own runs with python -m resolver trace <run> until Module 2.
Common mistake
The tests say 72, not 76
Symptom: after you copied the lesson’s files, python -m pytest -q still ends with 72 passed.
Cause: the test file tests/test_obs_cli.py did not arrive, or you ran the tests in another folder.
Diagnose: ls tests/test_obs_cli.py (Windows: dir tests\test_obs_cli.py). If it is missing, the copy failed. On Windows, also check that $S is set in the same terminal.
Recover: do step 1 of Add the lesson’s files again, then run the tests.
Your turn: the other run
Section titled “Your turn: the other run”Change one condition: read another run of the same Wednesday evening. Before you run anything, predict.
-
Predict: run R-1014-051, on ticket T-90606, was proposed at 19:31 on Wednesday, also on chat-strong. Its log line says
status=resolved writes=1 reply=sent, like R-1014-040’s. How long did it wait for a person? How many refund calls do you expect in trace 2, and with which keys? -
Read its trace:
Terminal window python -m obs trace R-1014-051 --data data/telemetry/week -
Compare it with your prediction, and with R-1014-040’s trace.
Check your prediction
The course’s output (replayed decisions, simulated faults):
... waited 13 h 44 min for a person (this trace has a link to a186588bf9ac5a21 in trace 93c0fb55...)Trace 2 f346995f983d307ccc832d6df8228be8  Thu 15 Oct 09:16:27  10.0 s     0.0 s |========================|  10.00 s  approve support-resolution  approved by usr-sam (agent, limit 100)     0.0 s |=                       |   0.00 s    execute_tool request_refund  ERROR unavailable  LK-645556  9.95 RFD-LATE  key c18d8c3f31b823c4     0.0 s |========================|  10.00 s    execute_tool request_refund  ERROR timeout  LK-645556  9.95 RFD-LATE  key c18d8c3f31b823c4    10.0 s |                       =|   0.00 s    execute_tool request_refund  done  LK-645556  9.95 RFD-LATE  key c18d8c3f31b823c4-retry2    10.0 s |                       =|   0.00 s    execute_tool send_reply  sent
Outcome: resolved
It waited 13 h 44 min, and Sam approved it 45 seconds before R-1014-040. Trace 2 has three refund calls. The first was refused at once (unavailable: the service made no refund; this ticket’s own recorded practice fault). The second, with the same key, timed out after the refund was made. The third went with a new key, -retry2, and made a second refund. So R-1014-051 is the week’s second double refund. Its log line is one of the 83 that you counted in the first lesson, the same as those of the correct runs. The first call shows that a retry with the same key is fine: the second call reused it. The new key caused the problem.
Knowledge check
Section titled “Knowledge check”Check your understanding
In your own double refund, what was replayed, what was simulated, and what was measured?
Show the answer
Replayed: chat-strong’s two model decisions, with their recorded tokens, latency and cost. They are the lookup of LK-793996 and the proposed refund of 9.95 under rule W2. Simulated: the payment service that made the refund and answered too late (–fault request_refund:timeout_after_write), and the retry with a new key (–naive-retry). Measured: what your own computer did with them: the two changes in the practice database and the log line.
Does your answer have the main points of ours?
Sign in and enroll in the course to save your answers. Every check counts toward the certificate.
Check your understanding
Module check: explain why a log of the final reply cannot explain an agent's action. Use an example from the workflow.
Show the answer
The final reply is the model’s words to the customer, written before the action happened. The action is a series of steps that other parts of the system take after it. In run R-1014-040, the reply said “We’ll submit a refund of your $9.95 CAD shipping fee”. That is true for the model’s one proposal. But the second refund came from the workflow’s retry code, after a timeout, on the next day. No model and no person decided it. The reply, and the log line that says writes=1, cannot show that. The steps can: the trace shows two request_refund calls with two keys, and the audit trail shows which approval each write used.
Does your answer have the main points of ours?
Sign in and enroll in the course to save your answers. Every check counts toward the certificate.
Check your understanding
The agents course's command python -m resolver trace showed both writes of your run. Why is it not the answer to Grace's questions about the week?
Show the answer
It prints one run from the run’s saved state on the computer that ran it. Nobody else can read it, and it has no time for each step and no approval wait. It cannot search or count the 316 runs of a week. It is a debugging print. Grace needs records that leave the workflow, are kept, and can be searched and joined: traces, metrics, events and an audit trail.
Does your answer have the main points of ours?
Sign in and enroll in the course to save your answers. Every check counts toward the certificate.
Recap
- Every piece of evidence has a label: replayed, simulated, constructed, measured or assumption. The model decisions are replayed; the week’s traffic, faults and approval times are simulated.
- You caused the double refund yourself: two changes in the practice database, and a log line that says
writes=1. obs runs,obs trace,obs eventsandobs audit verifyread the saved week. Run R-1014-040 is two traces joined by a link, with a 15 h 25 min wait between them.- R-1014-051 is the week’s second double refund. Its log line looks like those of the correct refunds.
- Grafana is optional; Module 4 starts it. Delete
work/to start again.
Your project now: ~/projects/observable-workflow, the same as the snapshot end-of-m01, with obs, the saved weeks and 76 tests that pass. You can now read Larkfield’s saved telemetry. But your own workflow still writes only one log line per ticket. Next, in Module 2, you make it record each run as a trace with OpenTelemetry.