
When not to build a model
- Lesson 17
- 30 min
- Module 5: Machine learning forecasters
Where we are
In the last three lessons, the backtest table got machine learning and foundation model rows. The most accurate method was not the cheapest, and the cheapest took ten times longer to fit. In this lesson, we read the whole table for cost, speed and trust, and see where an LLM fits: the forecast note, not the numbers. Think first of how a family chooses a car.
Lesson 17 of 27 · Forecasting and Time Series: Predict What Comes NextWhen not to build a model
1. Forecasts serve decisions
2. Read a time series
3. Baselines and honest testing
4. Statistical forecasters
5. Machine learning forecasters
6. Hard series and many series
7. Uncertainty and the decision
8. Run a forecast in production
What you will be able to do
Choose a forecasting method the way Kenji pays for it. Look at the cost of the decision, the work to run the method, and how far people can trust it. Sometimes the simple method wins. And an LLM can write the weekly note about the forecast, but it must never make the numbers.
NotebookDo this lesson in a notebook
The notebook has every code cell, task and check of this lesson. It sorts the backtest table three ways and compares ETS, the seasonal naive forecast and LightGBM product by product. Then it checks every number in ten forecast notes that an LLM drafted. It makes no model calls: the notes were recorded once. Its setup cells install the packages and download the data, so it needs no local setup. About 30 minutes.
Colab and Kaggle open your own copy. They need a free Google or Kaggle account. Stuck? See the solution notebook.
Before you startWhat to know and to have ready
What you need to know
- The backtest table and its columns, from Measure the error that matters.
- The rows of this module: Forecasting as regression, Gradient boosting with LightGBM and Deep and foundation models.
- What an LLM is: a model that writes text from a prompt. See the LLM course if it is new to you.
What you need on your computer
Nothing: the notebook runs in Colab or Kaggle. It needs no API key.
Tested in Jupyter on macOS, with Python 3.12, pandas 2.3.3, statsforecast 2.1.1, mlforecast 1.1.0 and LightGBM 4.7.0.
How a family chooses a car
Section titled “How a family chooses a car”A family needs a car for the school run and the weekly shopping. The magazine’s test says that one sports car is the fastest on the track. The family does not buy it. It costs more to buy, to insure and to repair, and it has no room for the shopping. A small car is slower on the track and better for their week.
The test on the track is real. It answers a different question. A good choice reads every column of the test: speed, price, running costs, and what the car is for.
The problem: the winner changes with the column
Section titled “The problem: the winner changes with the column”The backtest table of the orders now has 13 rows. Three people read it, and each one finds a different winner.
- Tomás sorts by WAPE: Chronos-Bolt wins with 38.7%.
- Priya sorts by cost: the direct LightGBM wins with 13,711 dollars per order.
- Mei sorts by fit time: the naive forecast wins with 0.02 seconds for all 13 origins.
Each of them is right about their column. None of them has answered Kenji’s question: “Which method should run every Monday?”
The chart puts every row in the order of Kenji’s cost, with the WAPE next to it.
- Baseline
- Statistical method
- Machine learning
- Foundation model
Text description of the chart
The 13 methods, cheapest order first, with the cost per order and the WAPE: LightGBM direct 13,711 dollars (40.7%); LightGBM lags ≥ 14 14,629 dollars (40.9%); LightGBM recursive 14,749 dollars (40.7%); Chronos-Bolt 14,750 dollars (38.7%); linear regr., per product 15,137 dollars (41.7%); AutoARIMA 16,257 dollars (41.4%); ETS 16,578 dollars (41.3%); seasonal naive 16,739 dollars (51.3%); Theta 16,812 dollars (41.5%); linear regr., global 17,264 dollars (42.6%); moving average 28 d 19,444 dollars (43.5%); naive 28,261 dollars (53.2%); drift 28,570 dollars (53.8%).
Every value of the table, in the same order:
| Method | Kind | MASE | WAPE % | bias % | fit s (13 origins) | cost $ per order |
|---|---|---|---|---|---|---|
| LightGBM direct | machine learning | 0.813 | 40.7 | −0.6 | 156 | 13,711 |
| LightGBM lags ≥ 14 | machine learning | 0.828 | 40.9 | −0.7 | 12 | 14,629 |
| LightGBM recursive | machine learning | 0.816 | 40.7 | +0.7 | 16 | 14,749 |
| Chronos-Bolt | foundation model | 0.784 | 38.7 | −5.6 | 2 | 14,750 |
| linear regr., per product | machine learning | 0.835 | 41.7 | −1.4 | 13 | 15,137 |
| AutoARIMA | statistical method | 0.834 | 41.4 | +1.4 | 996 | 16,257 |
| ETS | statistical method | 0.832 | 41.3 | +0.1 | 46 | 16,578 |
| seasonal naive | baseline | 1.034 | 51.3 | −0.5 | 0.05 | 16,739 |
| Theta | statistical method | 0.837 | 41.5 | +0.1 | 42 | 16,812 |
| linear regr., global | machine learning | 0.866 | 42.6 | −0.1 | 0.33 | 17,264 |
| moving average 28 d | baseline | 0.875 | 43.5 | −0.1 | 0.11 | 19,444 |
| naive | baseline | 1.065 | 53.2 | +7.4 | 0.02 | 28,261 |
| drift | baseline | 1.075 | 53.8 | +7.8 | 0.04 | 28,570 |
Read the middle of the table. The seasonal naive forecast, “the same weekday last week”, costs 16,739 dollars. That is less than Theta and the global linear regression, and only 161 dollars more than ETS. AutoARIMA costs about the same as ETS and needed about 1,000 seconds instead of 46. And the 28-day moving average has a better WAPE than the seasonal naive forecast but costs 2,705 dollars more per order.
The idea: a complex model must earn its cost
Section titled “The idea: a complex model must earn its cost”A complex model is worth it only when its gain is larger than everything it costs. The table shows one part of the cost: the fit time. The rest is not in the table:
- Running it: a weekly job, its packages, its memory, and someone who fixes it when it breaks. Chronos-Bolt even needed its own process.
- Trust: Kenji must understand a forecast well enough to overrule it when he knows something the model does not.
- Change: a feature set or a pretrained model has more ways to break when the data changes.
So the question is never “which method is best?”. It is “is the gain over the simple method worth what the complex method costs here?”
A worked example: is LightGBM worth it for Larkfield’s orders?
Section titled “A worked example: is LightGBM worth it for Larkfield’s orders?”Take the cheapest simple method and the cheapest complex one:
| Seasonal naive | LightGBM, direct | |
|---|---|---|
| Cost per order | 16,739 dollars | 13,711 dollars |
| Fit time, 13 origins | 0.05 seconds | about 156 seconds |
| Code to run | one line | features, holiday flags, 14 models |
The gain is 3,028 dollars per order for the 50 products. A few minutes of fit time a week is cheap. Here, the complex model is worth building: the backtest says so in dollars, under the course’s cost assumptions. Doing this sum is the point of the lesson. The next cases show where the same sum goes the other way.
Where the simple method won
Section titled “Where the simple method won”Product by product
Section titled “Product by product”The table adds up 50 products. The notebook compares the WAPE of each product:
Text description of the chart
Lowest WAPE per product: Chronos-Bolt on 28 products, LightGBM (recursive) on 16, ETS on 3, AutoARIMA on 3. ETS beats LightGBM on 21 of the 50 products; the seasonal naive forecast beats LightGBM on 3.
ETS beats LightGBM on 21 of the 50 products. The seasonal naive forecast beats it on 3: P013, P029 and P075. LightGBM wins in total because it wins big on products such as the parasol (49.3% against 65.1% for ETS). For the other products, its lead is small or negative.
Slow sellers (Module 6)
Section titled “Slow sellers (Module 6)”Module 6 forecasts 140 slow product-region series: products that sell nothing on 70% of the days or more. Intermittent demand teaches them; here you need only the result. There, a forecast of always 0 has the best MASE of all (0.599). But it orders nothing, so its order costs 4,371 dollars. The cheapest order comes from the plain seasonal naive forecast (2,885 dollars). Croston’s method, a method built for slow sellers, costs 3,733.
The help-desk roster (Module 7)
Section titled “The help-desk roster (Module 7)”For Grace’s roster, Theta has the best ticket WAPE (27.1%). From forecast to order and roster sets the roster from a high quantile of the forecast. Then MSTL gives the cheapest roster: 3,718 dollars a week, against 5,845 for Theta, whose range is far too wide. MSTL is a statistical method that fits in about 3 seconds.
Signs that a complex model is not worth it
Section titled “Signs that a complex model is not worth it”- Its gain over the seasonal naive forecast or ETS, in the decision’s cost, is small next to its running costs.
- It wins on the error measure but not on the cost (Chronos-Bolt here, or Theta for the roster).
- It wins in total but loses on many products.
- You have few series or short history, so there is little to learn.
- Nobody on the team can explain its forecast to the person who acts on it.
- It needs its own process, a GPU or a large download that the team cannot run.
Where an LLM fits: the forecast note
Section titled “Where an LLM fits: the forecast note”Every Monday, Omar wants a short note: what the plan orders, how many agent hours it staffs, and what to watch. Priya writes it by hand. A large language model (LLM) can draft it in seconds.
Tomás goes one step further: “Why not ask the LLM for the forecast itself?” Because it fails every test of this course. An LLM writes text that is likely, not numbers fitted to Larkfield’s 400,000 rows. Nobody can backtest it in the same way, it can give a different answer to the same question, and it cannot show its cost column. The forecasting job computes the numbers. The LLM only turns them into sentences.
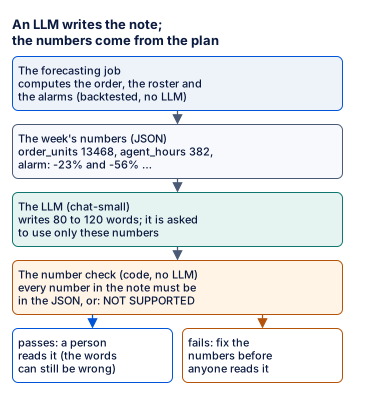
Text description of the diagram
Four boxes from top to bottom. The forecasting job computes the order, the roster and the alarms, with backtested methods and no LLM. The week’s numbers go out as JSON, for example 13,468 units to order, 382 agent hours and an alarm of −23% and −56%. The LLM, chat-small, writes 80 to 120 words and is asked to use only these numbers. A number check, written in code with no LLM, requires every number in the note to be one of the numbers in the JSON. Then there are two outcomes. If the note passes, a person reads it, because the words can still be wrong. If it fails, someone fixes the numbers first.
The check, on ten recorded notes
Section titled “The check, on ten recorded notes”The course recorded 10 notes once, from Azure’s chat-small deployment, for 10 weeks of the forecasting job of Module 8. They used 3,831 input and 4,546 output tokens, about US$0.003 in total at the course’s price table (prices change: check the current page). The check finds every number in the note and looks for it in the numbers that the LLM received:
NUMBER = re.compile(r"(?<![\w.])[-+]?\d[\d,]*(?:\.\d+)?%?")   # 12,839 or -23% or 0.5
def check(note, facts):    """The numbers in the note that are not in the facts (within 1%). 1, 2, 7 and 14 are always allowed."""    allowed = {value(m) for m in NUMBER.findall(json.dumps(facts))} | {1.0, 2.0, 7.0, 14.0}    return [m for m in NUMBER.findall(note) if not any(abs(value(m) - a) <= 0.01 * max(abs(a), 1) for a in allowed)]
The output for the ten notes:
2025-03-10 passes2025-03-17 NOT SUPPORTED: ['23%', '56%']2025-03-24 passes2025-03-31 passes2025-04-07 passes2025-04-14 passes2025-04-21 passes2025-04-28 passes2025-05-05 passes2025-05-12 passesNine notes pass. The note of 17 March 2025 does not. The notebook prints the first 115 characters of the alarm and the sentence of the note with the same numbers:
ALARM: BIAS ALARM plants-and-seeds: the forecast was too low 2 weeks in a row (-23% and -56%, weeks of 2025-03-03, 2025-03NOTE: A bias alarm says the plants-and-seeds forecast was too low for 2 weeks in a row: by 23% and 56% in the weeks of 2025-03-03 and 2025-03-10The LLM dropped the minus signs. In this sentence, “too low by 23%” still means the same. But the check cannot read meaning, and in a table or a shorter sentence, “+23%” and “−23%” are opposite advice: order more, or order less.
The check has a limit in the other direction too. The note of 10 March passes. Its first sentence says: “Larkfield’s plan for the week of 2025-03-10 is to handle 12,839 orders”. The plan says order_units: 12839: 12,839 units to order, not customer orders. The number is right; the word is wrong. A check of numbers does not check meaning. A person still reads every note before it goes out.
What the LLM note costs
Section titled “What the LLM note costs”- Money: a fraction of a cent per note.
- The check: a few lines of code, run on every note.
- A reader: someone who reads the note against the plan, because some mistakes pass the check.
- Small surprises:
chat-smallis a reasoning model: it works through hidden steps before it writes its answer. The first recording call failed with an error, because it does not accept the usualmax_tokenssetting.
Common mistake
A dropped minus sign
Symptom: the note of 17 March says that the plants-and-seeds forecast was too low “by 23% and 56%”. The plan’s alarm says −23% and −56%. The number check flags the note: NOT SUPPORTED: 23%, 56%.
Cause: the LLM rewrote the numbers into its own sentence and dropped their signs. It was told to use only the numbers it got. An instruction is not a guarantee.
Fix: never send a note that fails the check. Ask for the numbers exactly as written in the plan. Or let the job write the numbers into fixed sentences, and the LLM only the rest. Then a person reads the note.
Consequence in AI work: a reader trusts a well-written note. A wrong sign in fluent text reverses the advice, and nobody notices without a check.
Guided practice: read the table, check the notes
Section titled “Guided practice: read the table, check the notes”- Open the notebook from the box Do this lesson in a notebook at the top of this page.
- Run the setup cells and the helper cell. The data cell ends with the
Ready:line. - In section 1, predict if the lowest WAPE has the lowest cost. Then run the cell. You see three different winners.
- In section 2, predict on how many products ETS beats LightGBM. Then run the cell (about a minute). You see 21 of 50.
- In section 3, write your answer in the Your turn cell, then run the check cell.
- In section 4, predict if all 10 notes pass. Then run the check. You see one note flagged.
- Run the next two cells. Compare the alarm with the note, then read the note of 10 March.
Your turn: the simplest method
Section titled “Your turn: the simplest method”Before you run anything, predict: on how many of the 50 products does “the same weekday last week” beat LightGBM? In the notebook, section 3, count them from per_product and put the count in naive_wins.
Show the answer
naive_wins = int((per_product["seasonal naive"] < per_product["LightGBM"]).sum())print(naive_wins, per_product.index[per_product["seasonal naive"] < per_product["LightGBM"]].tolist())3 ['P013', 'P029', 'P075']On 3 products, a one-line forecast beats a 400-tree model. P029 is the slowest of the 50 products and P075 the best seller. So the size of a product does not predict where the simple method wins. Only the backtest tells you.
Knowledge check
Section titled “Knowledge check”Check your understanding
Using the backtest table, explain why Kenji should not simply take the method with the lowest WAPE.
Show the answer
Kenji pays for the order, not for the daily error. Chronos-Bolt has the lowest WAPE (38.7%), but it is biased low (−5.6%) and its order costs 14,750 dollars. The direct LightGBM has a WAPE of 40.7% and the lowest cost, 13,711 dollars. The 28-day moving average has a better WAPE than the seasonal naive forecast (43.5% against 51.3%). But it costs 19,444 dollars against 16,739. The method must be chosen on the cost of the decision, then on fit time, running costs and trust.
Does your answer have the main points of ours?
Sign in and enroll in the course to save your answers. Every check counts toward the certificate.
Check your understanding
Give two cases from the course where a simple method beats a complex one, and one case where the complex method is worth its cost.
Show the answer
Simple wins: ETS beats LightGBM on 21 of the 50 products, and the seasonal naive forecast on 3. On the slow sellers, the seasonal naive forecast has the cheapest order (2,885 dollars), cheaper than Croston’s method (3,733). For the roster at a high quantile, MSTL is the cheapest (3,718 dollars a week) although Theta has the better WAPE. Complex is worth it for the 50 products’ orders. The direct LightGBM costs 3,028 dollars less per order than the seasonal naive forecast, for a few minutes of fit time.
Does your answer have the main points of ours?
Sign in and enroll in the course to save your answers. Every check counts toward the certificate.
Check your understanding
Why does Larkfield use an LLM for the weekly note but not for the forecast, and what can the number check not catch?
Show the answer
The forecast must be backtested, repeatable and scored on the cost of the decision. An LLM writes likely text, not numbers fitted to the data. So the backtested job computes the numbers. The LLM only turns them into sentences. Code checks that every number in the note is in the plan. 9 of 10 recorded notes passed; the note that dropped the minus signs of −23% and −56% was flagged. The check cannot catch a wrong meaning: the note of 10 March calls 12,839 units “orders” and passes. A person must still read the note.
Does your answer have the main points of ours?
Sign in and enroll in the course to save your answers. Every check counts toward the certificate.
Recap
- The winner changes with the column. Chronos-Bolt wins by WAPE (38.7%). The direct LightGBM wins by cost (13,711 dollars). The naive forecast wins by fit time.
- A complex model must earn its cost in the decision’s dollars, after running costs and trust. For the orders, LightGBM does: 3,028 dollars less per order than the seasonal naive forecast.
- Simple wins elsewhere: ETS beats LightGBM on 21 of 50 products. On slow sellers, the seasonal naive forecast gives the cheapest order. MSTL gives the cheapest roster.
- An LLM writes the note, never the numbers. Check every number in code: 9 of 10 notes passed, and one dropped its minus signs. Then let a person read the note.
You can now choose a forecaster by what it costs, not only by its error. But every forecast so far was for one product at a time. Larkfield’s products add up to categories, regions and a total, and the forecasts must agree. Next, you make forecasts at every level of the hierarchy add up.