
Counting, and tracking in brief
- Lesson 16
- 35 min
- Module 4: Detect and count
Where we are
We have detectors that find Larkfield's boxes. Hamid does not want boxes: he wants a number. In this lesson, we count from boxes, from a density estimate and by a rule, and we see where crowding breaks each one.
Lesson 16 of 30 · Vision AI: See, Count and InspectCounting, and tracking in brief
1. Seeing is a business problem
2. Baselines and pretrained classifiers
3. Embeddings, CLIP and few labels
4. Detect and count
6. Inspect for defects
7. Match, search and describe
8. Run vision in production
What you will be able to do
Turn photos of pallets into a count that Hamid can use. Compare three ways to count: from a detector’s boxes, by a rule, and with a density estimate. See where crowding breaks each one. Then decide when a count from one photo is enough, and when you need to track objects across video frames.
NotebookDo this lesson in a notebook
The notebook counts the 30 test pallets in three ways: from the recorded boxes of the fine-tuned detector, with the white-label rule, and with a density estimate that it trains on the 40 training pallets. It draws all three counts against the truth. Its setup cells install PyTorch and download the pallet photos and a ResNet-18 model (47 MB). About 35 minutes; the cells run in under a minute after the setup.
Colab and Kaggle open your own copy. They need a free Google or Kaggle account. Stuck? See the solution notebook.
Before you startWhat to know and to have ready
What you need to know
- Boxes, IoU and NMS, from Boxes and IoU.
- The fine-tuned detector and OWLv2, from Fine-tune a detector on a few images.
- Image features from a pretrained network, from The idea: an embedding in Image embeddings.
What you need on your computer
- For the notebook: nothing. It runs in Colab or Kaggle.
- For the project steps: your
larkvisionproject with thevision countcommand.
Tested with Python 3.12, PyTorch 2.15.0 and timm 1.0.31 on macOS. The Windows commands are the same; they were not run.
Three ways to count coins
Section titled “Three ways to count coins”A shop closes for the day. How much money is in the coin box? There are three ways to find out.
- One by one: pick up each coin and count it. Exact, but slow, and easy to lose your place in a big pile.
- By a rule: count only the large coins, and multiply by what you know about the mix. Fast, but wrong on a day when the mix changes.
- By weight: put the whole box on a scale. You never touch a single coin. Fast, and good for big piles, but never exact.
Counting boxes on a pallet has the same three ways.
The problem: Hamid wants a number, not boxes
Section titled “The problem: Hamid wants a number, not boxes”Hamid does not look at rectangles. He compares the number of boxes on a pallet with the number on the delivery note. A wrong count means a missing box that nobody looks for, or a search for a box that was never there.
The detector of the last lesson counts loose and medium pallets almost perfectly. On tight pallets it is off by 6.9 boxes a photo. Are there ways to count that do not need to find every box?
Way 1: count the boxes of a detector
Section titled “Way 1: count the boxes of a detector”The first way is the one you know: run a detector, apply the score line and NMS, and count the boxes left. It is the “one by one” way.
The count depends on the two lines. Try them again on the tight pallet, now with the count in mind.
Explore
Two lines, one count
Predict first: On the tight pallet S-063, with NMS at 0.50, you raise the score line from 0.60 to 0.90. Will the count go up, go down, or stay at 22?
- True box (dashed)
- Kept box, right
- Kept box, wrong
The boxes are the recorded boxes of the detector fine-tuned on 40 pallet photos, before non-maximum suppression. It keeps its best 200 boxes a photo, so the lowest score here is about 0.34. The photos are drawn by our code (synthetic).
- Boxes on the pallet
- 22
- Boxes above the score line
- 133 of 200
- Count: boxes kept after NMS
- 22
- Count error
- 0
- Right boxes (IoU at least 0.5)
- 21
- Wrong boxes
- 1
- Missed boxes
- 1
The score line 0.60 keeps 133 of the 200 recorded boxes. NMS at IoU 0.50 removes 111 overlapping boxes and keeps 22. The pallet has 22 boxes. 21 kept boxes are right, 1 is wrong, and 1 true box is missed. The count is right, but the boxes are not all right: a wrong box and a missed box cancel out.
Text description of the explorer
The explorer shows a pallet photo with dashed true boxes, blue kept boxes that match a true box, and orange kept boxes that match none. The controls choose the photo (S-063, tight, or S-062, medium), the score line from 0.30 to 0.95 and the NMS line from 0.10 to 1.00. The readout shows the boxes above the score line, the count after NMS, the count error, and the right, wrong and missed boxes. On S-063 with NMS 0.50: at score 0.60 the count is 22 (21 right, 1 wrong, 1 missed); at 0.50 it is 23; at 0.90 it is 13, all right, with 9 boxes missed. On S-062, the count stays at 24 for every score line from 0.40 to 0.90 with NMS between 0.10 and 0.60.
At score 0.90, the count falls to 13: every kept box is right, but 9 boxes are missed. The detector is less sure about boxes that touch, so a high line drops exactly the hard boxes. On the medium pallet, the count stays at 24 for every score line from 0.40 to 0.90, with any NMS line up to 0.60. Crowding makes the count sensitive to the lines.
Way 2: a rule with no model
Section titled “Way 2: a rule with no model”Look at the pallet photos again. Most boxes carry a white shipping label. White is easy to find: a pixel whose red, green and blue values are all above 200.
The rule:
- Find the very light pixels.
- Group touching light pixels into blobs, and keep the blobs of at least 12 pixels.
- 7 boxes in 10 carry a label on these pallets, so divide the number of blobs by 0.7.
This is the “count the large coins” way. It needs no model, no labels and no training, and it runs in about 4 milliseconds a photo.
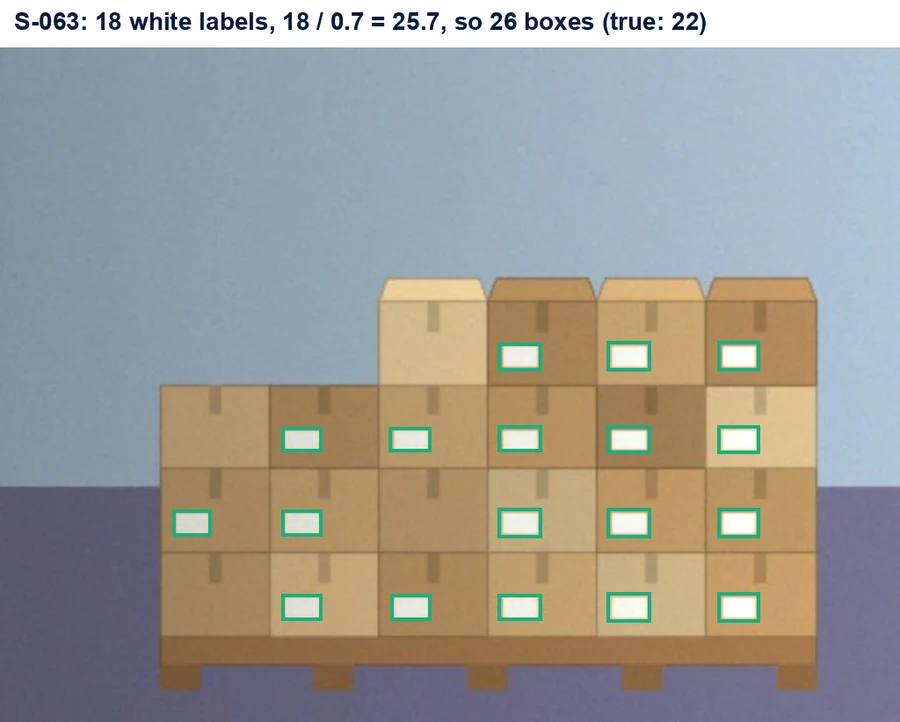
Text description of the diagram
A synthetic pallet with 22 boxes in tight rows. 18 small white labels each have a green rectangle around them. Four boxes have no label. The title gives the sum: 18 labels divided by 0.7 is 25.7, rounded to 26 boxes, against 22 true boxes.
On all 30 test pallets, the rule’s count error is 5.23 boxes a photo. It is worst on loose pallets (6.1), not on tight ones (5.2). Two things go wrong, and neither is crowding:
- The share of labels moves. On average 7 boxes in 10 carry a label. On one pallet it can be 9 of 9: then 9 ÷ 0.7 = 13 for 9 boxes. The fewer boxes on a pallet, the more the share moves.
- Other white things count. On S-064, a very light background forms one huge white blob, and the rule says 31 for 9 boxes.
Way 3: a density estimate
Section titled “Way 3: a density estimate”The third way is the scale. A density estimate does not find any box. It cuts the photo into small cells and predicts, for each cell, how much “box” is in it. The count is the sum over all cells.
A tiny example
Section titled “A tiny example”A constructed example: a photo cut into 4 × 5 cells. A model has written into each cell how many box centres it expects there.

Text description of the diagram
A grid of 4 rows and 5 columns. Row 1: 0.0, 0.4, 1.1, 0.9, 0.1. Row 2: 0.2, 1.8, 2.3, 2.0, 0.6. Row 3: 0.3, 2.1, 2.6, 2.2, 0.7. Row 4: 0.0, 0.9, 1.4, 1.2, 0.2. Darker cells hold larger numbers. The row sums are 2.5, 6.9, 7.9 and 3.7, and the count is 21.0, about 21 boxes.
No cell has to be exact. A cell can say 2.3 where the truth is 2; the next cell says 1.8 where the truth is 2. The errors partly cancel in the sum. That is why density estimates are popular for very crowded scenes, such as crowds of birds or cells under a microscope.
Larkfield’s density estimate
Section titled “Larkfield’s density estimate”The course’s density estimate is small, on purpose:
- Features: the pretrained ResNet-18 of Modules 2 and 3 gives 256 numbers for each 16 × 16 pixel cell of a pallet photo: 24 × 32 cells.
- Target: for each cell of a training photo, the number of true box centres in it. On the training photos we know every box, so this is free.
- Model: a ridge regression (a linear model with a penalty on large weights) from the 256 numbers to the number of centres. It is trained on the 40 training pallets.
The count error is 3.33 boxes a photo: loose 3.46, medium 2.77, tight 3.76. It takes about 23 milliseconds a photo and the 47 MB ResNet-18.
This density estimate is weak: it is worse than the detector on loose and medium pallets, where the detector is almost perfect. It is a simple member of its family, with a linear model and 40 photos. Research models for crowd counting are much larger. But even this one does something the detector cannot do: its error on tight pallets (3.76) is about half of the detector’s (6.9).
The three ways side by side
Section titled “The three ways side by side”- Boxes (detector)
- Density estimate
- Rule: labels ÷ 0.7
Text description of the chart
A chart with three points across: loose, medium and tight, and the count error from 0 to 8 up. Boxes from the fine-tuned detector: 0.2, 0.4 and 6.9. Density estimate: 3.46, 2.77 and 3.76. Rule: 6.1, 4.4 and 5.2.
Every pallet, one dot per method:
- Boxes (detector)
- Density estimate
- Rule
Text description of the chart
A scatter plot with the true count from 0 to 60 across and the counted boxes from 0 to 70 up, with a line where both are equal. The detector’s dots lie on the line up to about 24 boxes. On the tight pallets, with 22 to 51 boxes, they spread: for example 57 for 51, 65 for 46, 35 for 44 and 40 for 27. The density dots lie within about 4 boxes of the line on most pallets, at every size; the largest misses are 11 too many and 8.5 too few. On the tight pallets they are mostly a little below the line, for example 44.1 for 51 and 36.9 for 44. The rule’s dots spread on both sides at every size, for example 31 for 9 boxes and 63 for 51.
The comparison table, with the cost of each way:
| Way | Count error | Worst crowding | CPU time a photo | Model | Labelled photos |
|---|---|---|---|---|---|
| Boxes: fine-tuned detector, score 0.6 | 2.5 | tight, 6.9 | 87 ms | 74 MB | 40 |
| Density estimate (ResNet-18 + ridge) | 3.33 | tight, 3.76 | 23 ms | 47 MB | 40 |
| Rule: labels ÷ 0.7 | 5.23 | loose, 6.1 | 4 ms | none | 0 |
| OWLv2, “a cardboard box” | 14.0 | tight, 36.9 | 1,260 ms | 620 MB | 0 |
Two more rows are in the table: vision-language models, which Module 7 measures. A recorded hosted model counted all 30 pallets exactly (error 0.0), and a small local one had an error of 12.3. Our pallets are clean drawings, so that perfect score says little about real photos.
Larkfield: the count table in the project
Section titled “Larkfield: the count table in the project”-
Go to your
larkvisionfolder, with the virtual environment active andLARKVISION_DATAset (in a new terminal, see Meet the Larkfield images). Count with the rule:Terminal window vision count --method label-rulerule: count the white labels, divide by 0.7: count error 5.23 boxes a photo (bias +3.7), exact on 13% of photosloose 10 photos: error 6.1, bias +5.5medium 10 photos: error 4.4, bias +2.2tight 10 photos: error 5.2, bias +3.4The rule has no AP line: it finds no boxes.
-
Look at the counting rows.
vision compare --task countshows the course’s ten rows first, then your runs, marked(yours). Add--mineto see only yours:Terminal window vision compare --task count --mineThese are the rows after every run of this module, in the order of the lessons. They include the score line 0.1 of the “Your turn” in Pretrained detectors:
count: count error (MAE, boxes)method setting value worst worst_value ms_per_image model_mb labelled_images licencefinetuned-40 (score >= 0.6) (yours) pallets test 2.500 tight 6.900 - - - -finetuned-40 (score >= 0.5) (yours) pallets test 5.800 tight 16.7 - - - -fasterrcnn-coco (score >= 0.5) (yours) pallets test 20.5 tight 37.0 - - - -rtdetr-coco (score >= 0.5) (yours) pallets test 19.7 tight 36.3 - - - -rtdetr-coco (score >= 0.1) (yours) pallets test 16.3 tight 21.8 - - - -finetuned-10 (score >= 0.1) (yours) pallets test 5.000 tight 11.9 - - - -owlv2 (score >= 0.075, NMS 0.3) (yours) pallets test 14.0 tight 36.9 - - - -rule: count the white labels, divide by 0.7 (yours) pallets test 5.230 loose 6.100 - - - -If you ran other lines, you see more rows.
vision resetremoves your rows when you want a clean table.
Common mistake
A better line, found on the test photos
Symptom: Tomás tries more NMS lines with the project, and finds a much better count:
vision count --method finetuned-40 --score 0.5 --nms 0.3finetuned-40 (score >= 0.5, NMS 0.3): count error 1.57 boxes a photo (bias -1.17), exact on 70% of photos loose 10 photos: error 0.2, bias +0.2 medium 10 photos: error 0.0, bias +0.0 tight 10 photos: error 4.5, bias -3.7 AP at IoU 0.5: 0.867; kept boxes that cover two boxes: 26He wants to report 1.57 instead of 2.5.
Cause: he chose the lines by looking at the test pallets. The 30 test photos are now part of his choice, so 1.57 is too good to trust. On the next 30 pallets it could be better or worse; nobody knows yet. Look at the tight pallets: the bias turned from +4.3 to −3.7. The low NMS line now removes real boxes that touch their neighbours.
Fix: choose the score line and the NMS line on the 20 validation pallets only, as the course did for the score line. Then measure the chosen pair once on the test pallets, and once more on the hidden pallets before Hamid uses it. The recorded boxes in the project cover only the test pallets, so this choice needs a run of the detector on the validation pallets.
Consequence in AI work: every number that you use to choose something is no longer a fair test of that choice. Keep one set of photos for choosing and another for reporting.
Tracking, in brief
Section titled “Tracking, in brief”So far, every count came from one photo. Some counts come from video: boxes passing on a conveyor belt, or pallets moving past a gate. A box appears in many frames. If you count the boxes in every frame and add them up, you count each box many times.
Tracking gives each object an identity that stays the same from frame to frame. A simple tracker uses what you already know:
- Detect the boxes in each frame.
- Match each box to a box of the last frame, when their IoU is high (the object moved only a little).
- A box with no match is a new object: give it a new number. An object with no match for several frames has left.
- Count each number once, for example when its box crosses a line.

Text description of the diagram
Three frames of a conveyor belt, one above the other, each with a dashed vertical counting line. Frame 1: boxes #1 and #2, both left of the line. Frame 2: #2 has crossed the line (count 1), #1 is still left of it, and #3 has come in on the left. Frame 3: #1 has crossed the line (count 2), #2 is further right, and #3 has moved but not crossed. Box #2 appears in three frames and is counted once.
Tracking adds new problems. Two boxes that touch can swap numbers. A box hidden by a forklift for a few frames can come back with a new number and be counted twice. Trackers measure these errors with their own metrics; a dedicated tracking course would teach them. Public trackers exist as libraries; check their licences, as for the YOLO models.
When one photo is enough: the objects stand still and all of them are visible at once, as on Larkfield’s pallets. One photo per pallet, taken from the same place, is cheaper and easier to check than a video.
When you need tracking: the objects move, or they are never all visible at once: a conveyor belt, a loading dock, shelves filmed by a moving robot.
Which count for Hamid?
Section titled “Which count for Hamid?”- Loose and medium pallets: the fine-tuned detector. Error 0.2 to 0.4 boxes a photo, and Hamid can look at the boxes to check them.
- Tight pallets: no method is good enough alone. The detector is off by 6.9, the density estimate by 3.76. Send tight pallets to a person, or take two photos from two sides.
- No labels yet: the rule, as a first number and as a check on the others. It needs boxes with labels and a background that is not white.
A count error of 2.5 boxes a photo is an average. The count that matters is the one on the delivery note. A good service flags a pallet when two methods disagree by more than a few boxes, and asks a person.
Guided practice: three counts in the notebook
Section titled “Guided practice: three counts in the notebook”- Open the notebook from the box Do this lesson in a notebook at the top of this page.
- Run the setup cells. The first one installs PyTorch, which can take 2 minutes the first time.
- In section 1, run the cell. Loose pallets have 6 to 12 boxes, medium 11 to 24, tight 22 to 51.
- In section 2, run the cell. You see
error 2.5at score 0.6 anderror 5.8at 0.5. - In section 3, predict where the rule is worst. Then run the cell. You see
error 5.23 | loose 6.1 medium 4.4 tight 5.2. - In section 4, run the cell. It downloads ResNet-18 (47 MB) and fits the density estimate:
error 3.33. - In section 5, run the cell. It draws the three counts against the truth.
- In section 6, put the density estimate’s error on tight pallets in
density_tight. The check cell printsCheck passed.
Your turn: two methods on the crowded pallets
Section titled “Your turn: two methods on the crowded pallets”Count the 30 test pallets with two methods, and report the error on the 10 tight ones. Use the detector’s boxes at score 0.6, and one method that finds no boxes. Before you run anything, predict which of the two wins on the tight pallets.
Show the answer
With the density estimate: the detector’s error on tight pallets is 6.9, the density estimate’s is 3.76. The density estimate wins on tight pallets, and loses everywhere else (3.46 against 0.2 on loose ones).
With the rule: the rule’s error on tight pallets is 5.2. It also beats the detector there, but by less, and it is the worst of the three on loose pallets.
A report for Hamid: “On tight pallets, our best count is off by about 4 boxes a photo. Every tight pallet needs a person’s check. On loose and medium pallets, the detector is off by less than half a box.”
Knowledge check
Section titled “Knowledge check”Check your understanding
A density map has these cell values: 0.4, 1.2, 0.9, 1.6, 0.0 and 0.7. What count does it give? Why can no single cell be 'right'?
Show the answer
The count is the sum: 0.4 + 1.2 + 0.9 + 1.6 + 0.0 + 0.7 = 4.8, about 5 boxes. A cell does not hold whole boxes. It holds the part of the count that the model expects there, so 1.2 means “a bit more than one box centre”. Only the sum is compared with the truth, and the errors of the cells partly cancel in it.
Does your answer have the main points of ours?
Sign in and enroll in the course to save your answers. Every check counts toward the certificate.
Check your understanding
The label rule is worst on loose pallets (error 6.1), although loose pallets are the easiest for the detector. Explain why.
Show the answer
The rule does not look at boxes; it counts white labels and divides by 0.7. Two things break it, and neither is crowding. First, the share of boxes with a label moves from pallet to pallet, and more on small pallets: 9 labels on 9 boxes gives 9 ÷ 0.7 = 13. Second, other white areas count as labels: on S-064, a very light background is one huge blob, and the rule says 31 for 9 boxes. Loose pallets have few, large boxes, so both errors weigh more.
Does your answer have the main points of ours?
Sign in and enroll in the course to save your answers. Every check counts toward the certificate.
Check your understanding
Choose a method for Larkfield's pallet count. Give its error, its CPU time and its licence, and say what a person must still check.
Show the answer
The Faster R-CNN MobileNetV3 detector fine-tuned on 40 labelled pallet photos, at the score line 0.6 chosen on validation. Count error 2.5 boxes a photo: 0.2 on loose, 0.4 on medium and 6.9 on tight pallets. AP50 0.867. About 87 milliseconds a photo on a laptop CPU, 74 MB. Licence: BSD-3-Clause code (torchvision), with weights pretrained on COCO, whose photo terms the team must check. A person must still check every tight pallet: there the count is off by about 7 boxes, and wrong boxes can hide behind a right count. A person must also check any pallet where the detector and a second method, such as the density estimate, disagree by more than a few boxes.
Does your answer have the main points of ours?
Sign in and enroll in the course to save your answers. Every check counts toward the certificate.
Recap
- Count from boxes: the fine-tuned detector at score 0.6 is off by 2.5 boxes a photo. It is almost perfect on loose and medium pallets, and off by 6.9 on tight ones. The lines change the count, and must be chosen on validation photos.
- Count by a rule: white labels ÷ 0.7, error 5.23, in 4 ms and with no model. It breaks when the share of labels moves or other things are white, not when boxes touch.
- Count by density: the sum of a cell map. A weak linear version (ResNet-18 + ridge, 40 photos) has an error of 3.33, about the same at every crowding: 3.76 on tight pallets, half of the detector’s error there.
- Tracking keeps an object’s number across video frames, so a moving box counts once. One photo is enough when the objects stand still and are all visible.
You can now count Larkfield’s pallets three ways and say where each one breaks. But a box is still a rough shape: on a tight pallet, rectangles overlap, and they cannot say which pixels belong to which box. Next, we give every object its exact outline, and see when that is worth the extra cost.